
This post is for new subscribers that might not understand how I interpret chart patterns and especially wedges. There is a myth out there that a rising wedge or flag has to be bearish and a falling wedge has to be bullish. As I stated on numerous occasions that a wedge or flag pattern are the same as any other chart pattern. It can be a consolidation pattern or a reversal pattern depending on how many reversal points it has. Whichever way it breaks out is the direction of the next move.
Below are some examples of bullish rising wedges or bullish rising flags.
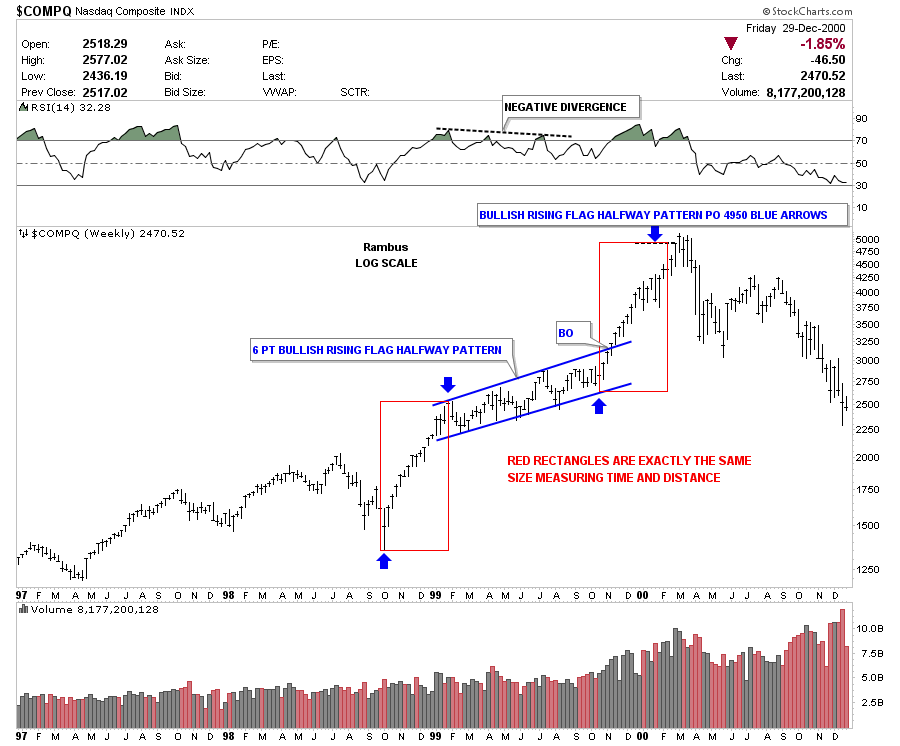
If one would have recognized the 6 point bullish rising flag during the grand finale of the great tech bull market that topped out in 2000, one would have gotten out very close to the top. The blue arrows measures the bullish rising flag as a halfway pattern.
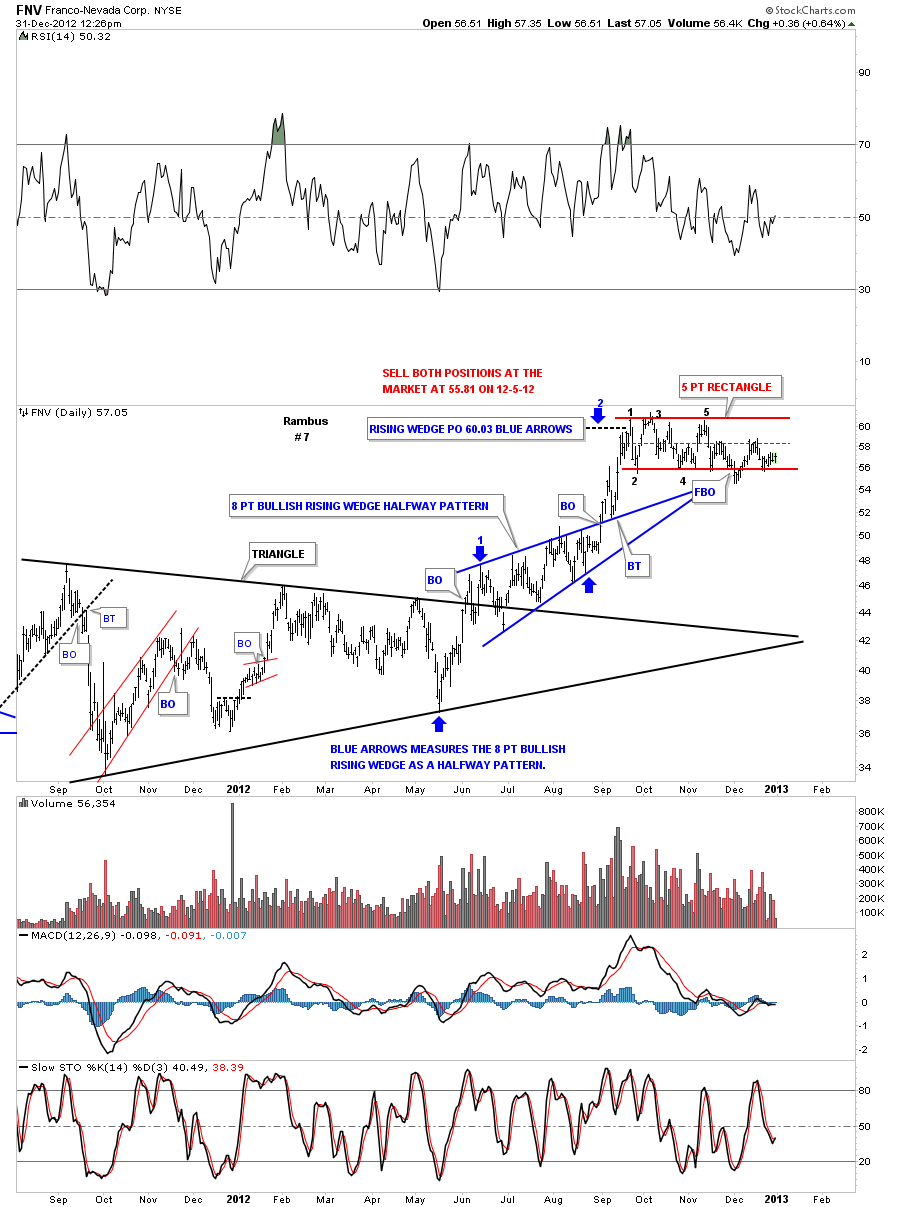
FNV had a beautiful 8 point bullish rising wedge halfway pattern that reached it’s price objective and now is either building a consolidation pattern or a topping pattern, red rectangle. You can see there was a false breakout from the bottom red rail where the price action immediately rallied back inside the rectangle and has, so far, been only able to reach the center red dashed rail. Which ever way the red rectangle breaks out will be the next move for FNV.
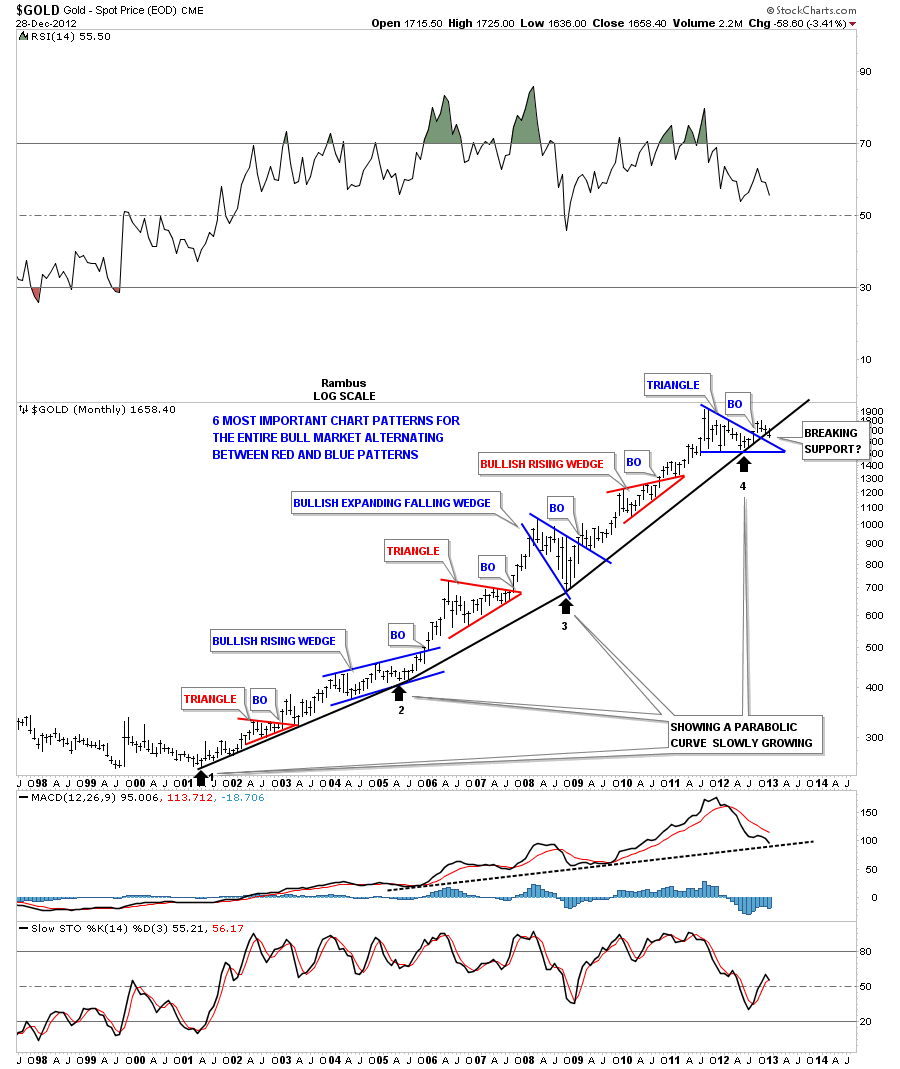
This next chart shows the important chart patterns for gold’s bull market to date. As you can see there have been two bullish rising wedges and another chart pattern that you won’t find in most books on chart patterns and that pattern is a bullish expanding falling wedge. As you may note each pattern on the chart below shows up at roughly the halfway point separating each impulse leg up.
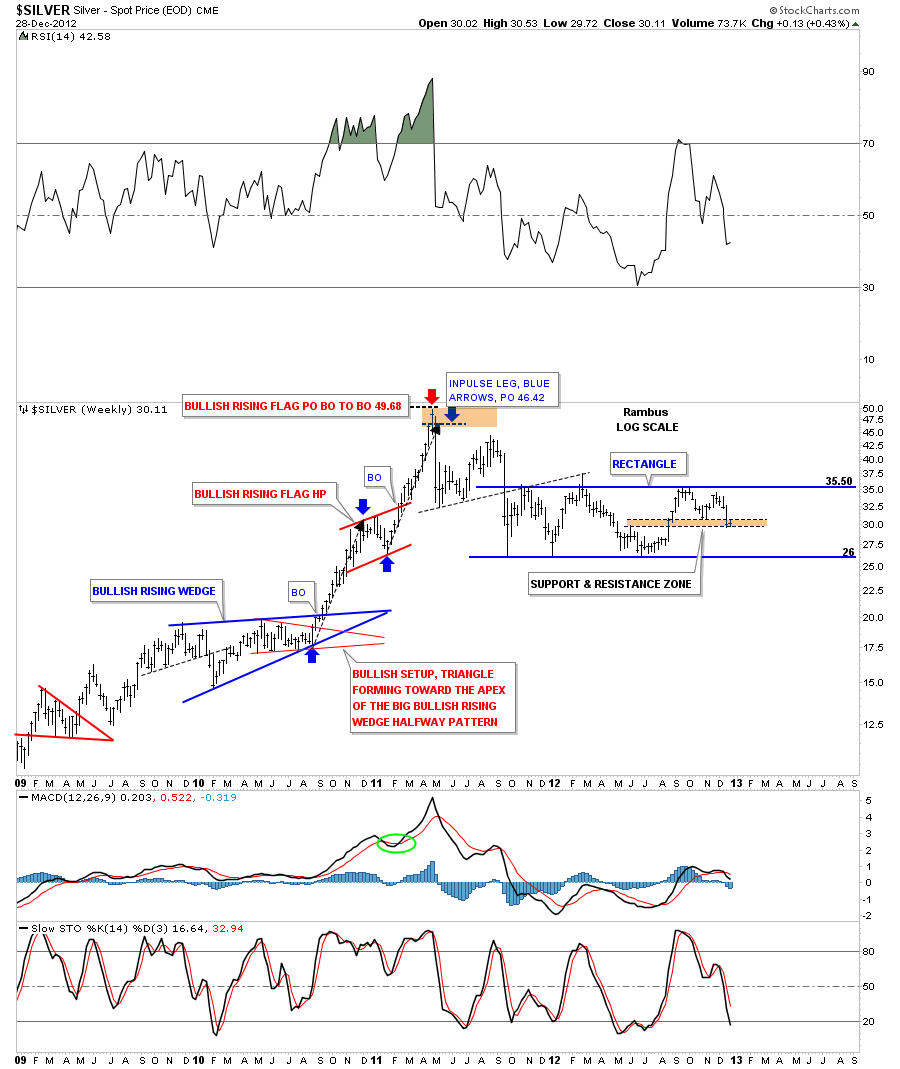
Silver built a beautiful bullish rising wedge that started the near parabolic rise to 50. There was also a red bullish rising flag halfway pattern that helped in determining the PO to 49.68. Note our current 5 point blue rectangle that is now trading in the brown shaded area that shows support at the previous little high at the bottom and the current double top hump. This is what I call a ping pong move bouncing between support and resistance.
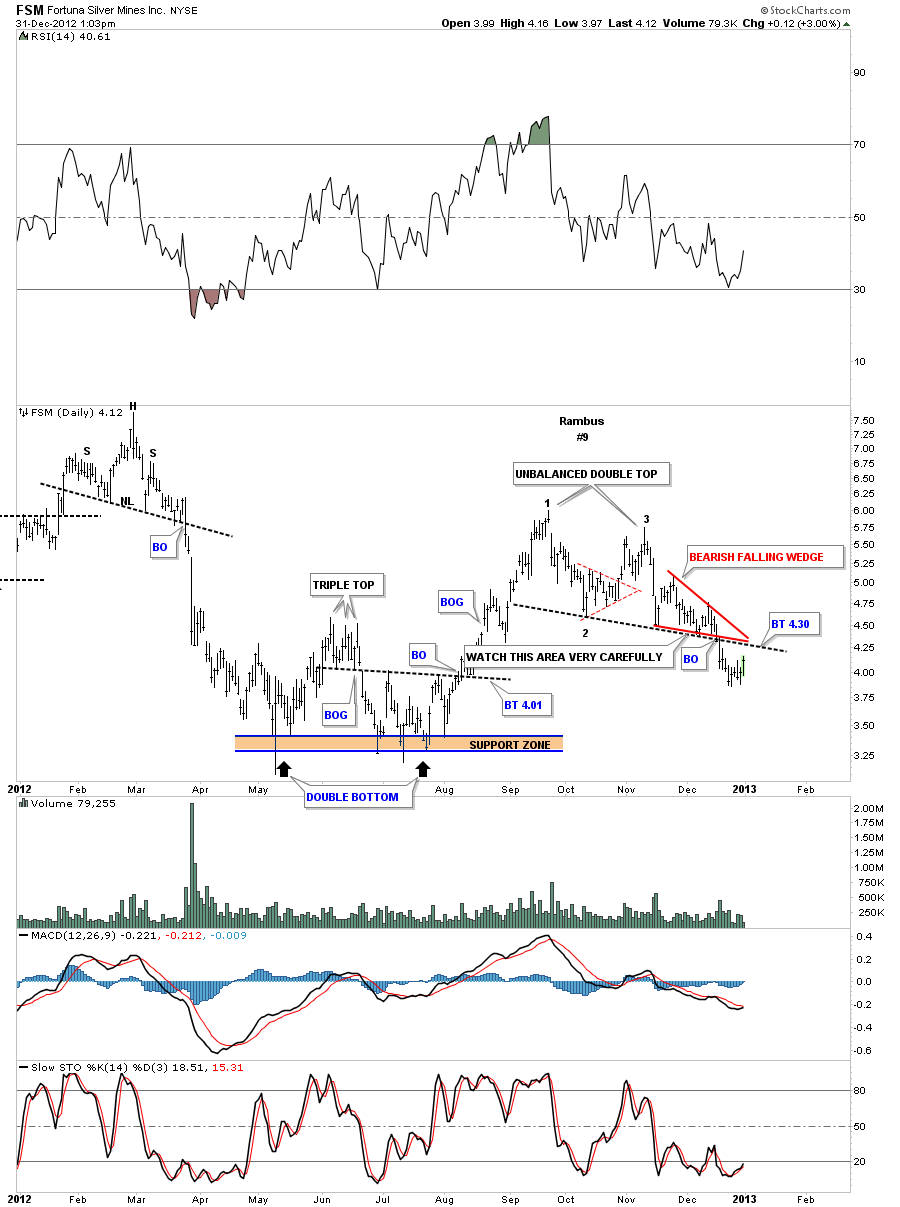
Here is a small bearish falling wedge that broke out to the downside and is now trying to backtest from below.
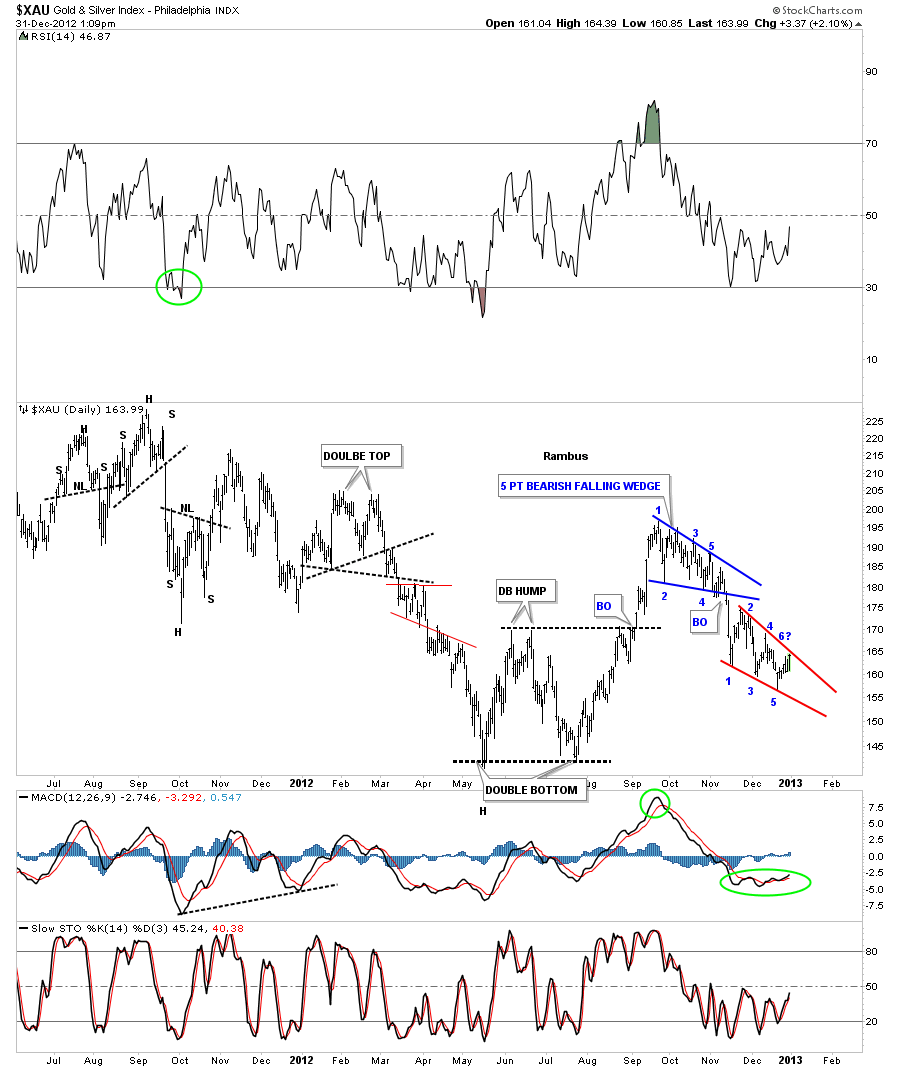
Lets look at the current setup for the XAU that shows the blue 5 point bearish falling wedge as the top and now we have another falling wedge that has 5 reversal points so far and is testing the top rail which it will either breakout to the topside or will reverse back down at point number 6? Critical test taking place today.
So again a rising wedge of flag can be either a consolidation pattern or a reversal pattern depending on how many reversal points its has. They are no different than any other chart pattern.
For More Chartology Tutorials and To Review Rambus Greatest Hits
visit Timeless Tutorials and The Wizard of Rambus at
www.rambus1.com