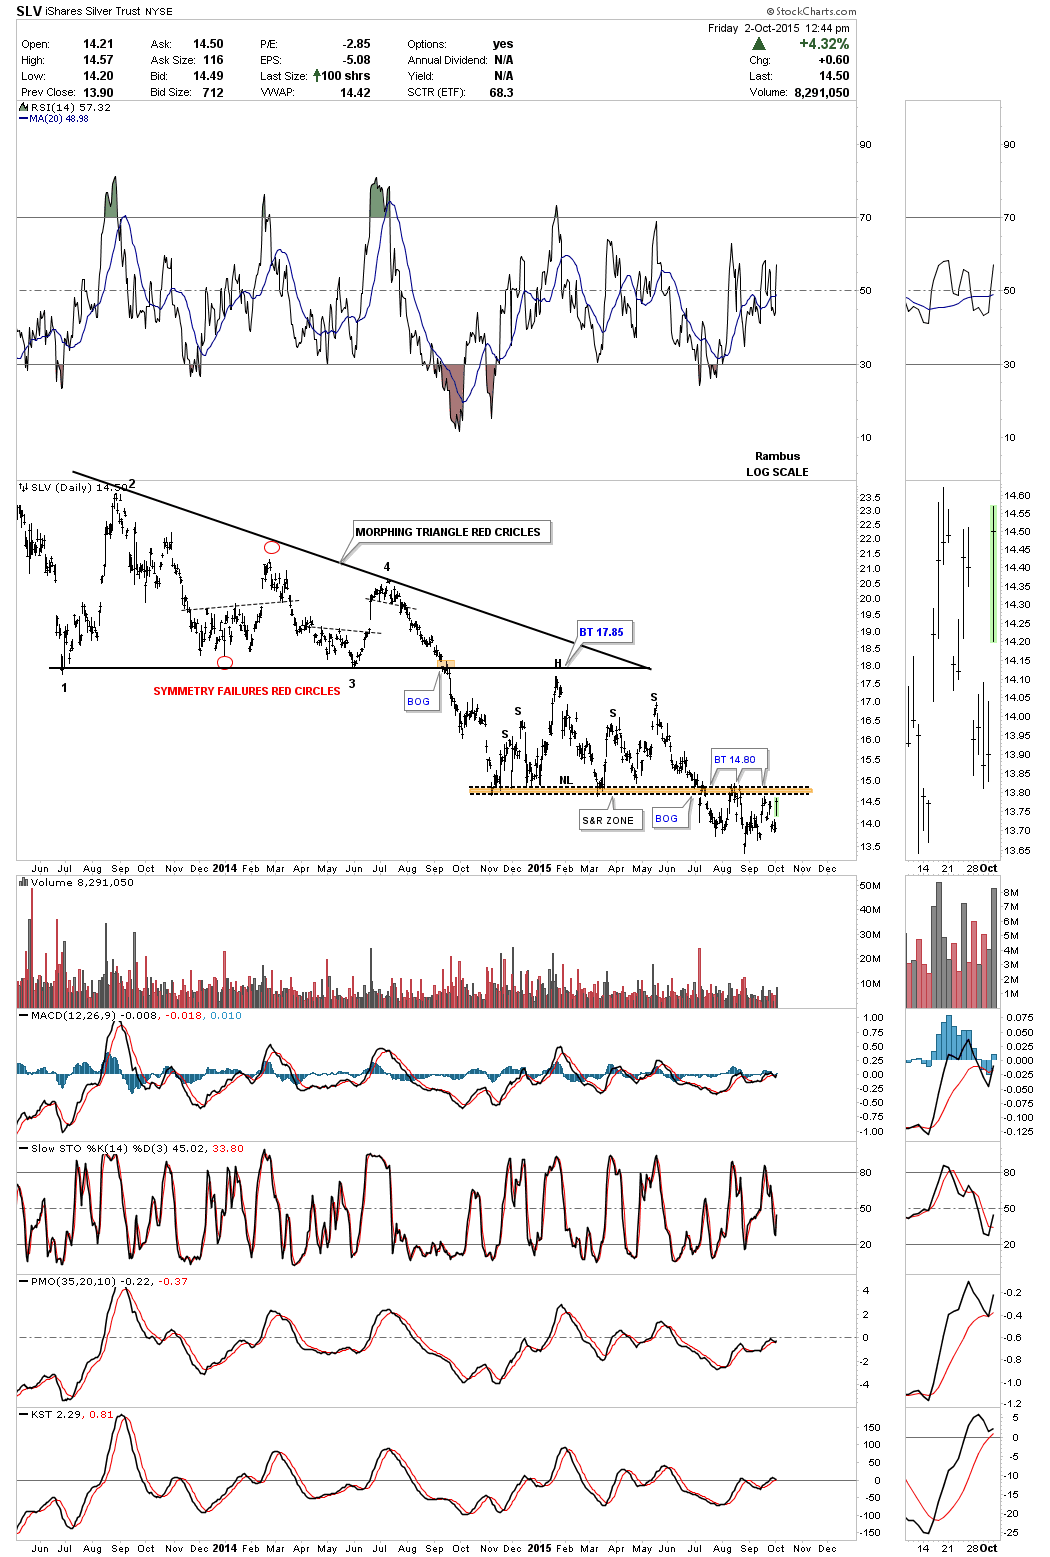
Below is the long term daily chart we’ve been following for SLV which shows the brown shaded S&R zone or neckline at the14.80 area as the backtest zone. Today’s price action also left a gap on the opening which most likely get filled as some point.
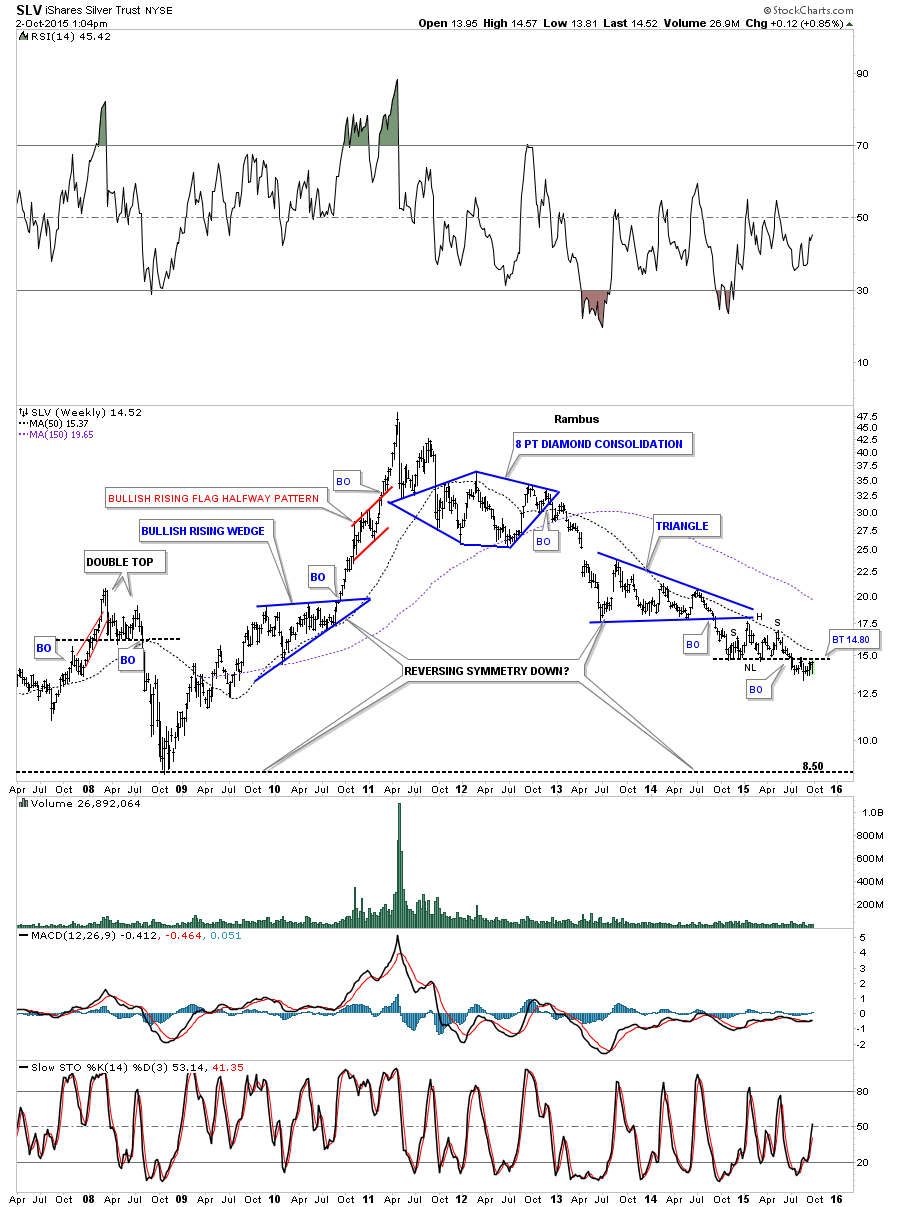
The weekly chart for SLV shows the H&S consolidation pattern forming just below the bottom rail of the blue triangle consolidation pattern. The 50 week ma now comes in at 15.37 which has done a good job of holding resistance over the last several years.
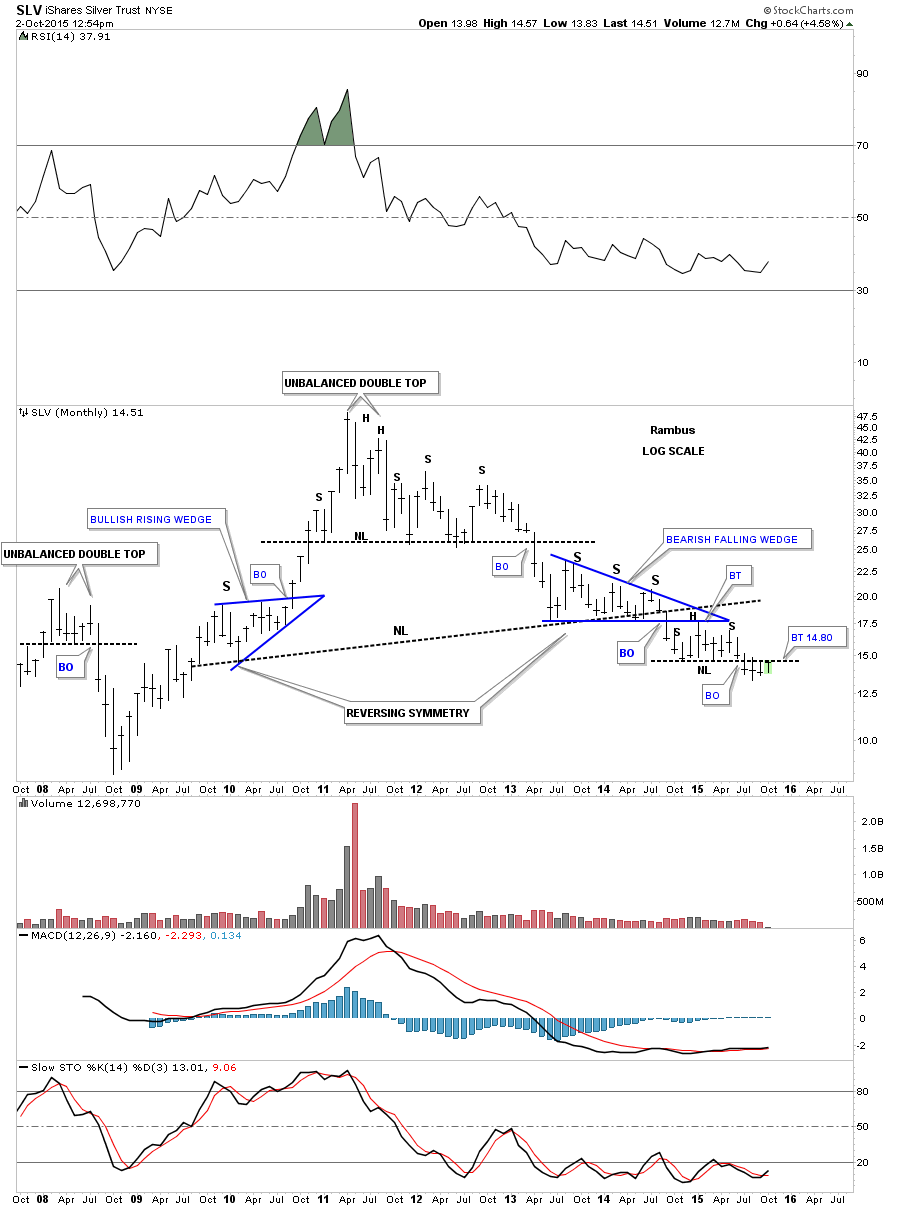
The long term monthly chart for SLV shows the small neckline starting its fourth month of holding resistance after the price action broke through it. So far the neckline has done its job reversing its role from what had been support to now resistance. A break above the 14.80 resistance line would be a feather in the bulls cap. Again another critical area to watch.