
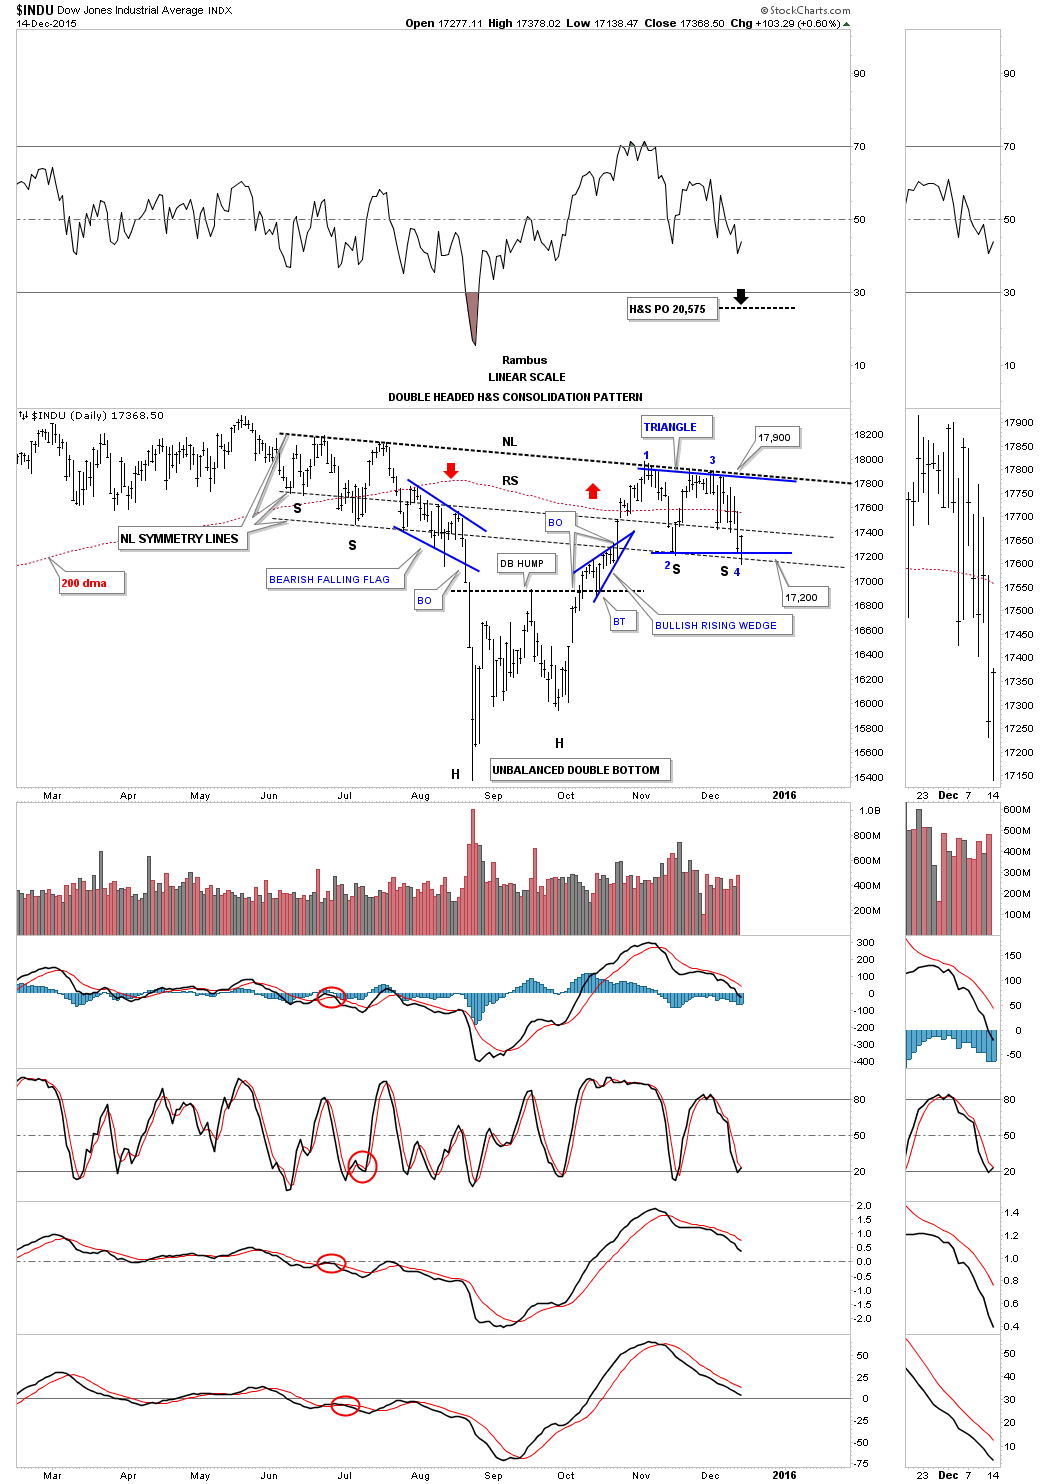
I wanted to wait until the end of trading today to update the INDU. It was a very interesting day in the INDU. Below is the daily chart we’ve been following which shows the potential H&S bottom. After the INDU bounced off the lower neckline symmetry line today it’s now showing a possible bull flag forming as the right shoulder. I haven’t had time to update the annotations yet but you can see how the bottom blue rail now slopes down slightly which is now parallel with reversal points one and three of the top blue trendline.
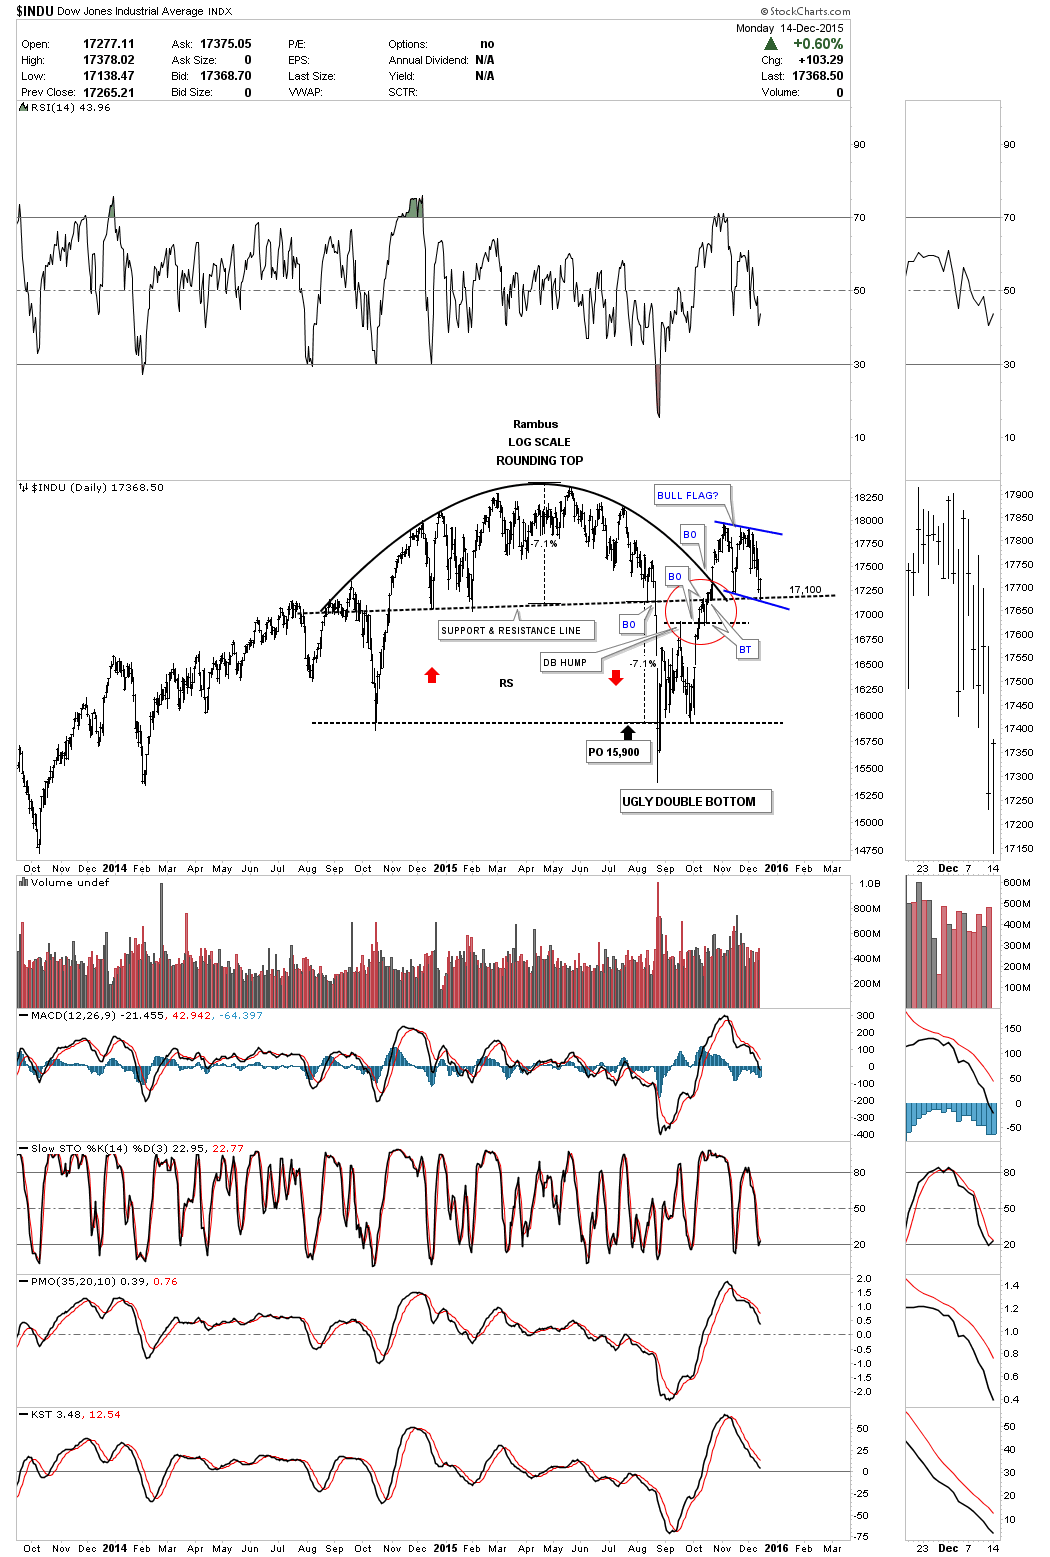
Below is another daily chart we’ve been following very closely which shows the rounded top. Note how today’s price action stopped right on that important support and resistance line around the 17,100 area. So far nothing is broken on this chart from a Chartology perspective.
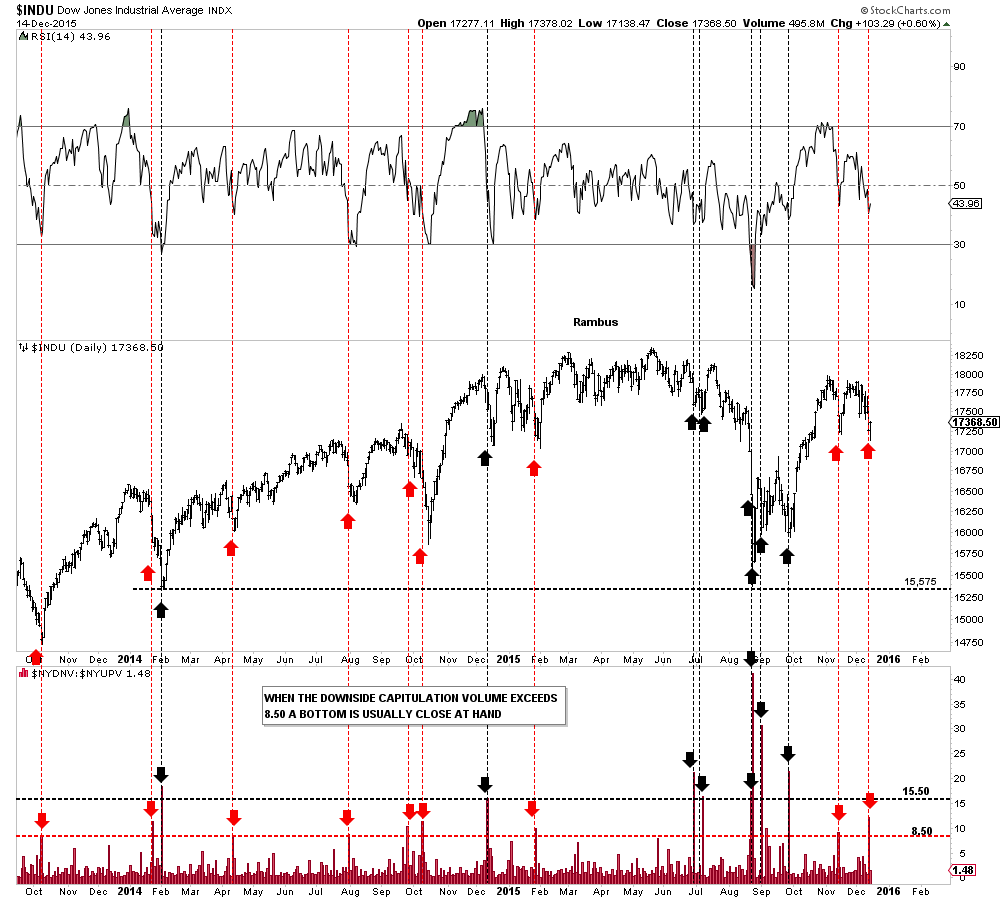
Below is the down to up volume chart which shows us when there is some capitulation taking place. Note the last two red arrows on the right side of the chart which shows some mild capitulation at both of the two recent lows.
I know it’s not a popular idea to be bullish on the stock markets with the possible rate hike coming this week but the weekly chart for the INDU is still showing a beautiful H&S consolidation pattern with price action testing the neckline symmetry line today. We now have a nice clean line in the sand at today’s low at 17,138. Keep in mind this possible H&S consolidation pattern is pretty big with a price objective over 20,000 or so.
