Excerpt from Tonight’s Wednesday Report
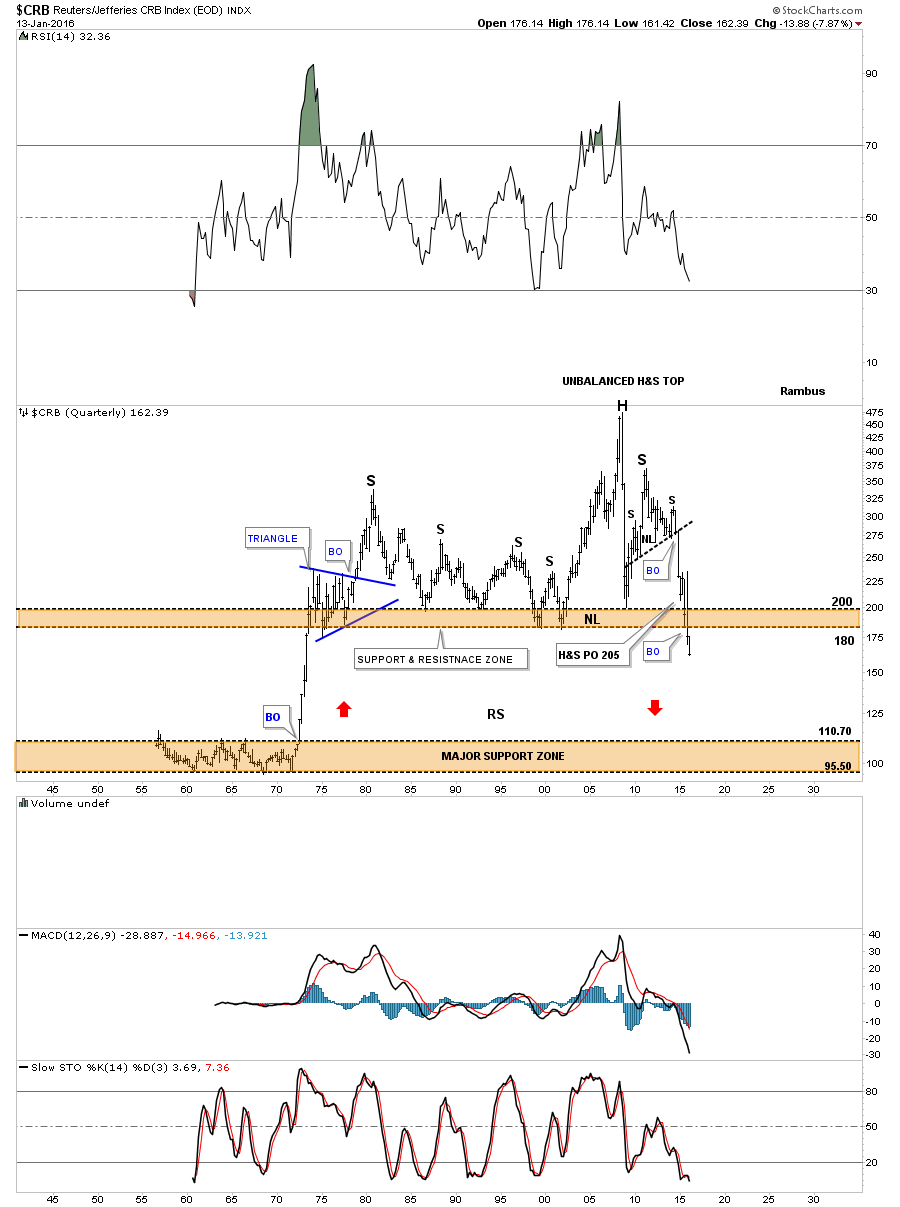
The implications of this 60 year quarterly chart for the CRB index is staggering if it completes this impulse move down which so far has been working out beautifully. Again on this massive time scale you can see an unbalanced H&S top that measures out to just below the major support zone at the bottom of the chart .
Back to the Future Indeed .