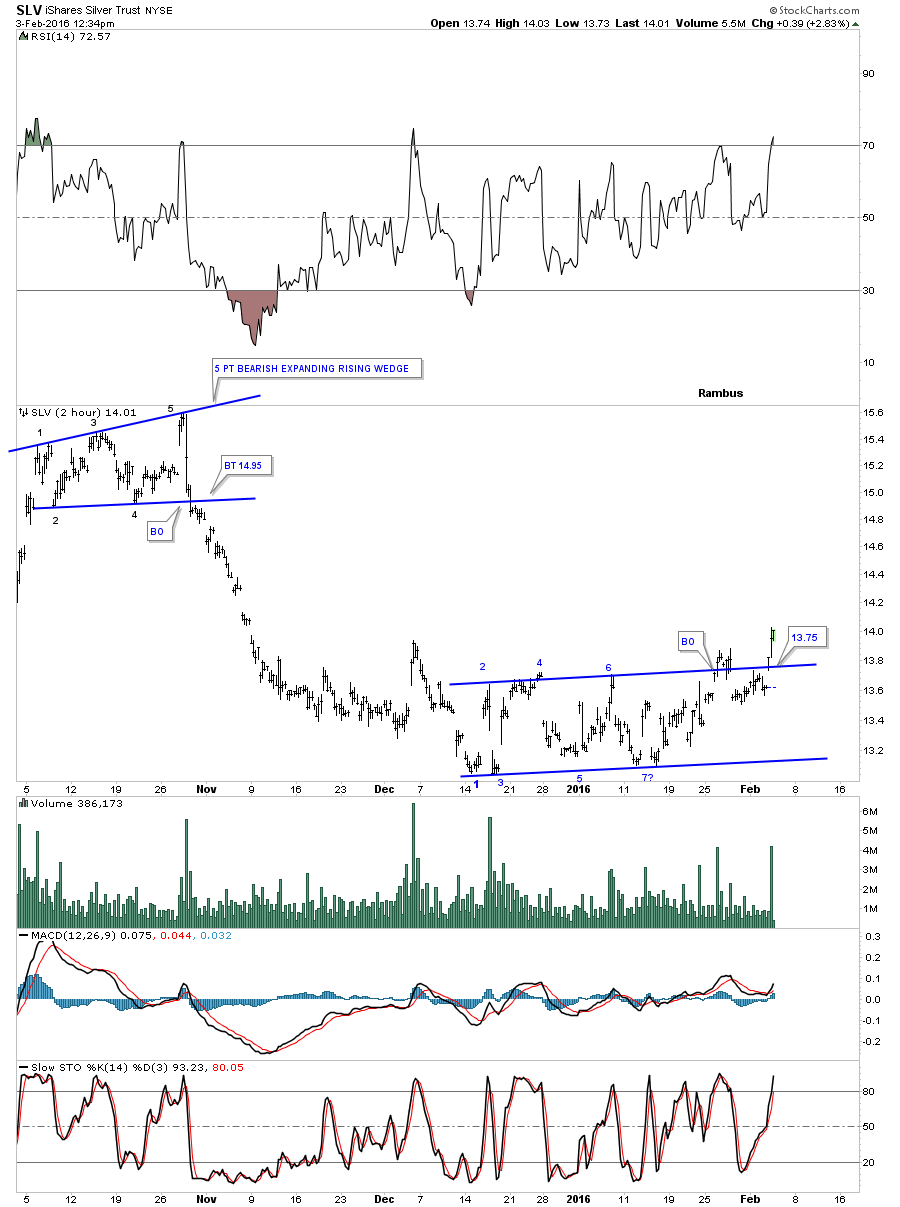
Last week we looked at this 2 hour chart for SLV which was showing a 7 point rising channel that had a false breakout above the top rail and the very next day it gapped below the top rail which looked bearish. This morning SLV gapped back above the top rail of the 7 point rising channel which, with an odd number of reversal points, equals a reversal pattern.
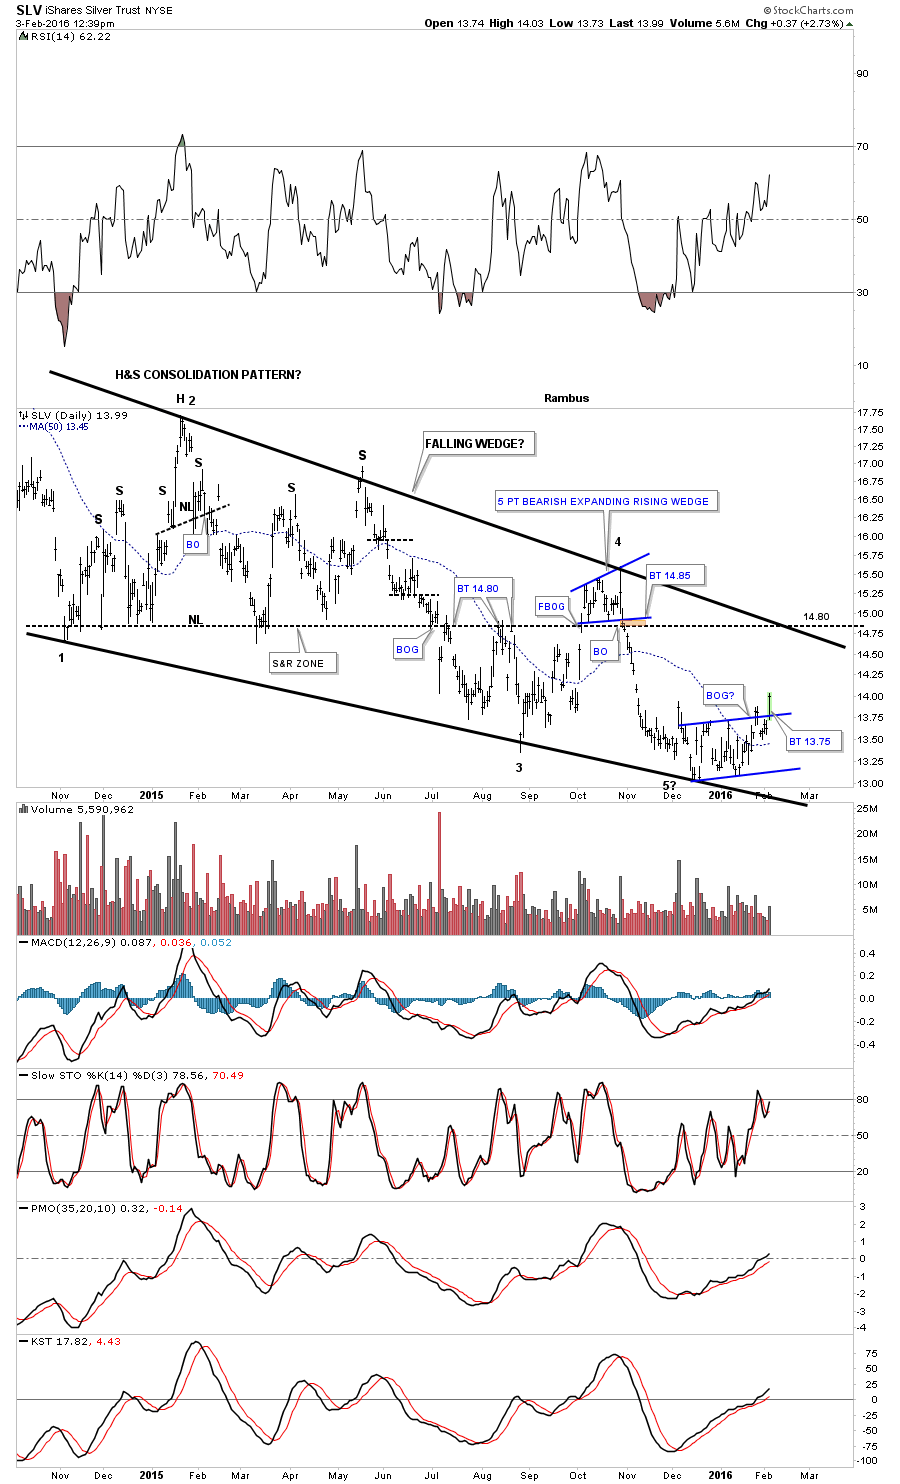
Below is the longer term daily chart which shows you our little blue rising channel and how it fits into the bigger picture. As you can see the little blue rising channel has formed at a possible 5th reversal point within the year old black falling wedge. It looks like the 14.80 area is going to determine if SLV is in a new bull market if the price action can close above the top rail.