Knowing when to go into a Risk On trade or a Risk Off trade is critical to understand. The risk on trade happens when the dollar is falling. A falling dollar makes everything more expensive as it takes more dollars to buy the same amount of goods that were bought when the dollar was higher and could buy more. Commodities are really affected by a falling dollar in a big way. The risk off trade generally happens when the dollar is rising causing deflation. Deflation is a big no no when you have a debt burden as big as the United States or the rest of the world for that matter. So the only way to try and fight the debt is to print more dollars which is actually a tax on you. We can’t deflate our way out of this economic situation but we can try to inflate our way by making the debt seem smaller as there are more dollars to pay down the debt. This is just a simple explanation of the Risk On and Risk Off trade.
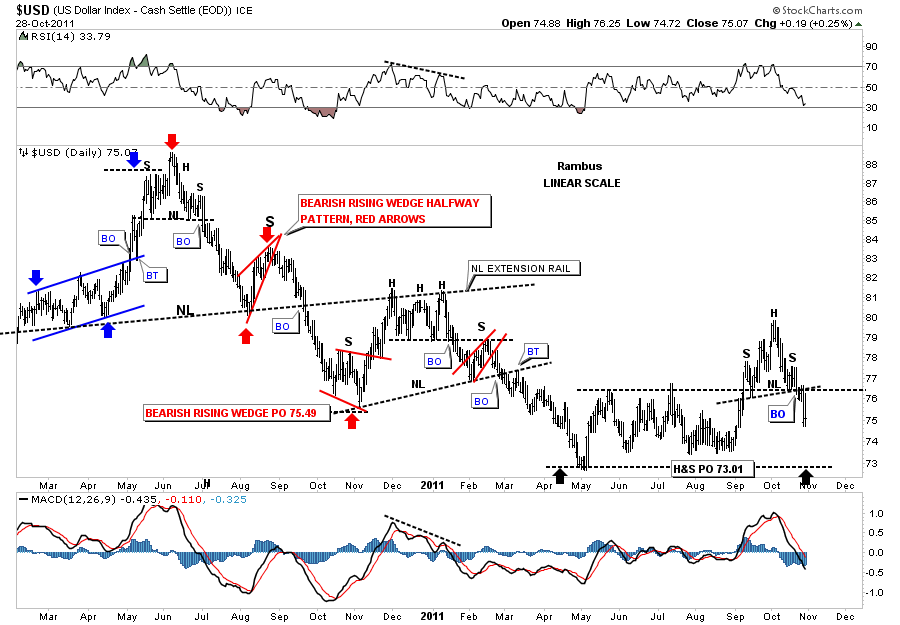
Since the US dollar plays such an important role in the risk on and risk off trades we need to look and see how the dollar is doing. The daily chart below shows the small rally the dollar enjoyed for the month of October. After hitting 80 the dollar stalled out and now has created a H&S reversal top pattern. This is why the stock markets, commodities and precious stocks have done so well the last couple of weeks, a falling dollar. This little H&S top projects down to the May low around 73 as a minimum.
Dollar daily look.
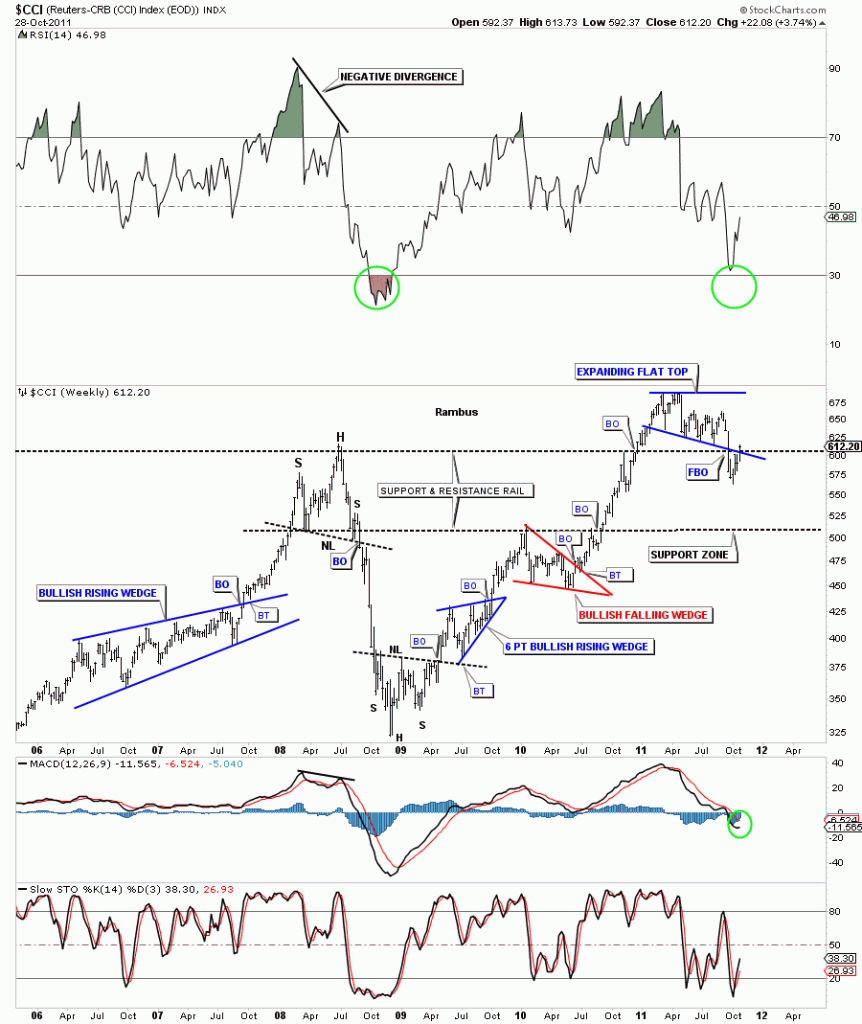
Next we need to look at the CCI commodities index to see how commodities have been doing in general. This index will give us a big clue as to risk on or risk off trade. After breaking the bottom rail of the expanding flat top, the CCI has managed to climb back into the pattern as the dollar has been breaking down from the H&S top. The false breakout on the CCI looks like a bear trap. Alot of times when you get a sharp break of a support rail and then manage to get back into the pattern, the bottom is in and a big move will probably take place.
CCI daily look.
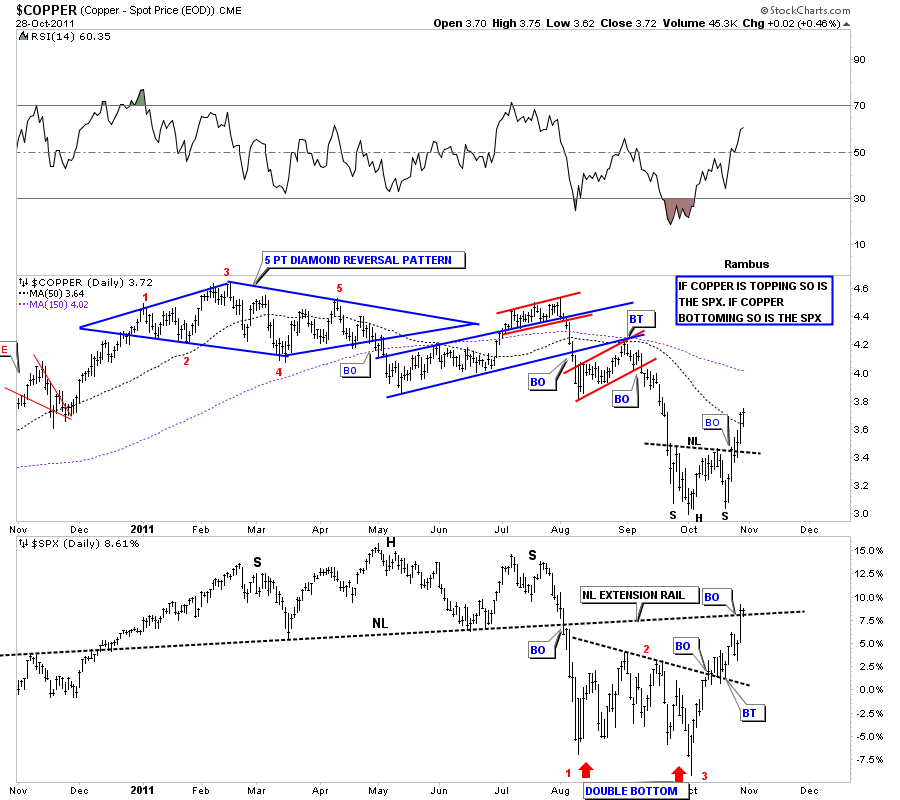
Lets look at some commodities and see if any of them have been bottoming as the dollar has been topping over the last couple of weeks. Copper is a key commodity that reflects commodities and stock market strength or weakness. The chart below shows a good example of how a strong or weak copper price affects the stock market. As you can see when copper is falling so is the stock market and when copper is rising the stock market is also rising reflecting the strength and demand from a growing economy. Copper has completed a very nice H&S bottom while the SPX bottomed with a Double Bottom. This chart shows a good example of a Risk on trade.
Copper top SPX bottom daily look.
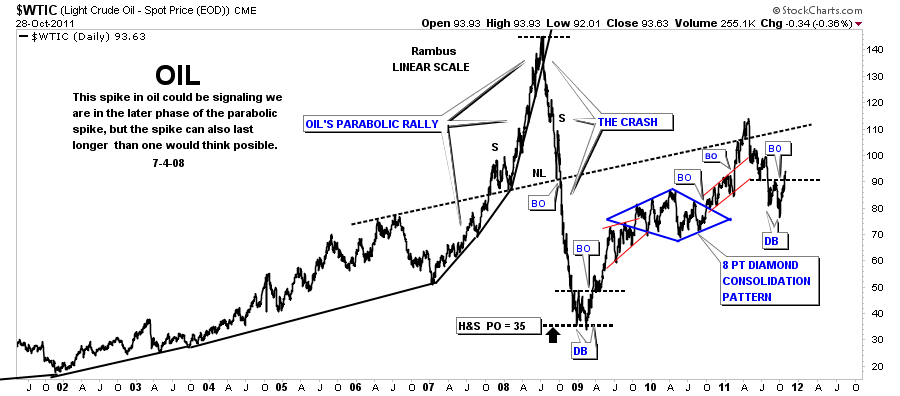
Oil is another important commodity that is affected by a rising or falling dollar. The chart below is one of my favorite oil charts going all the way back to the beginning of it’s bull market in 2002. It shows the parabolic move to 147 and then the even faster move down into the commodities crash low at the end of 2008. The crash low ended with a double bottom similar to the double bottom we have just broken out of recently. Note the price objective from the H&S top that occurred during the parabolic rise and the steep decline. The linear scale oil chart nailed the bottom of the crash almost to the penny. Pretty amazing. The H&S price objective is also the top of the very long term trading range that goes way back in time.
OIL long term daily look. Current double bottom.
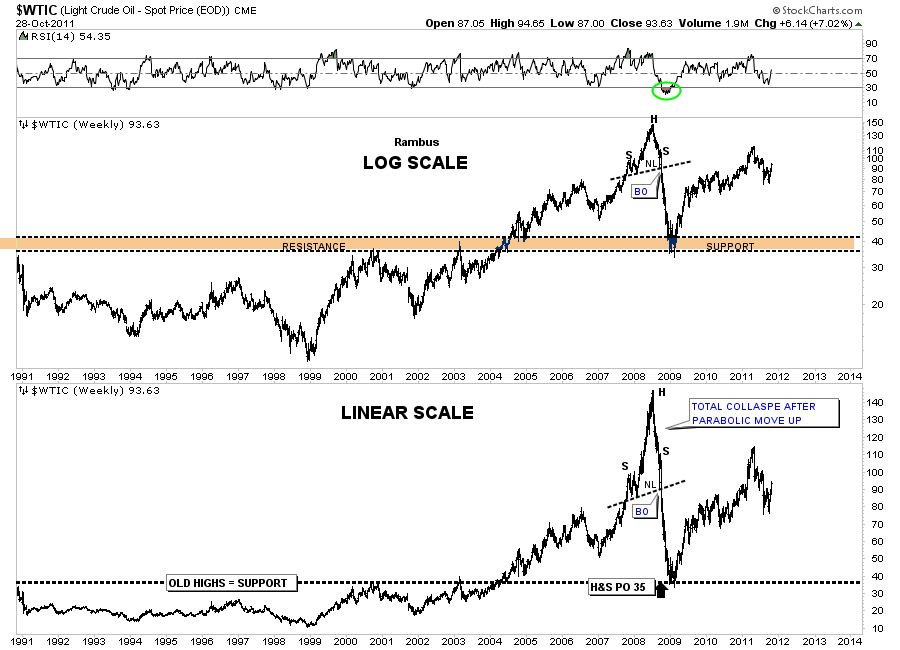
The 20 year oil chart is a good study in support and resistance. Note where the 2008 crash ended. Right on the old resistance highs that held oil in check throughout it’s history. Now that resistance reversed it’s role and is now long term support.
OIL long term chart.
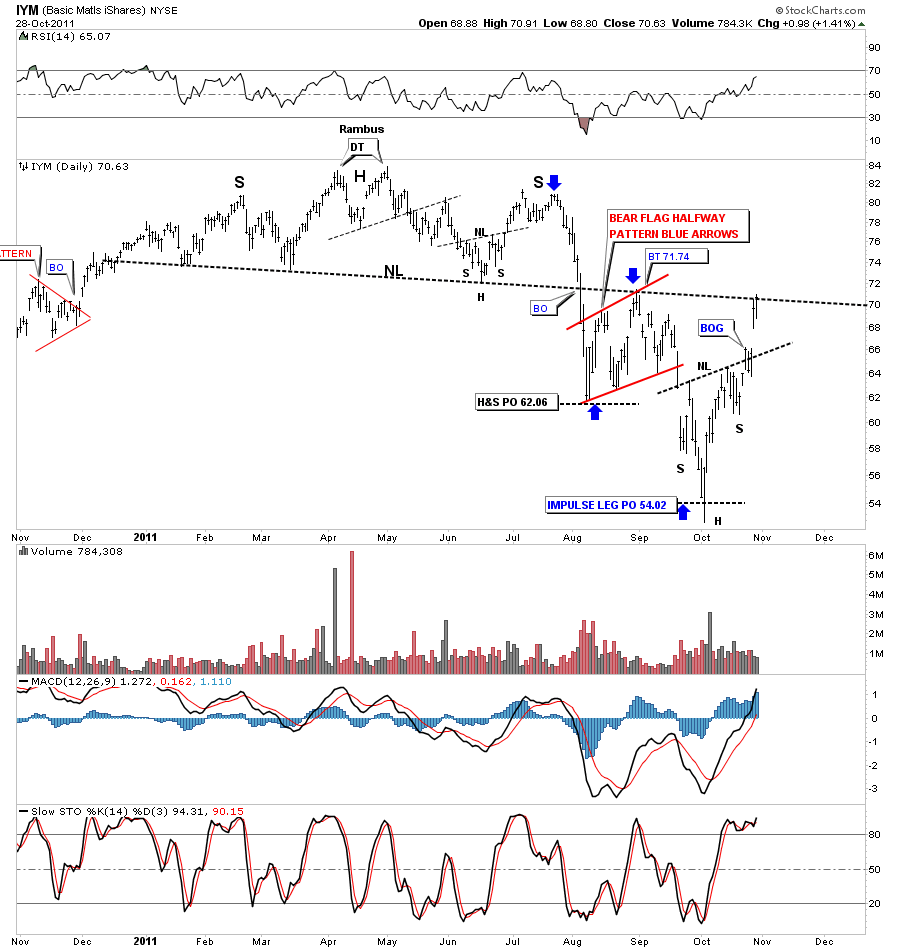
The IYM, Basic Materials ETF, is another good place to look for inflation visa vie a falling dollar. The IYM, like copper, has also put in a H&S bottom and has rallied all the way up to to the big H&S top and just hit the neckline from below. The H&S top formation is what led to our 3 months or so of a deflation scare that looks like it is not going to materialize this go around. Alittle pause here to refresh should be expected over the very short term.
IYM basic materials daily look.
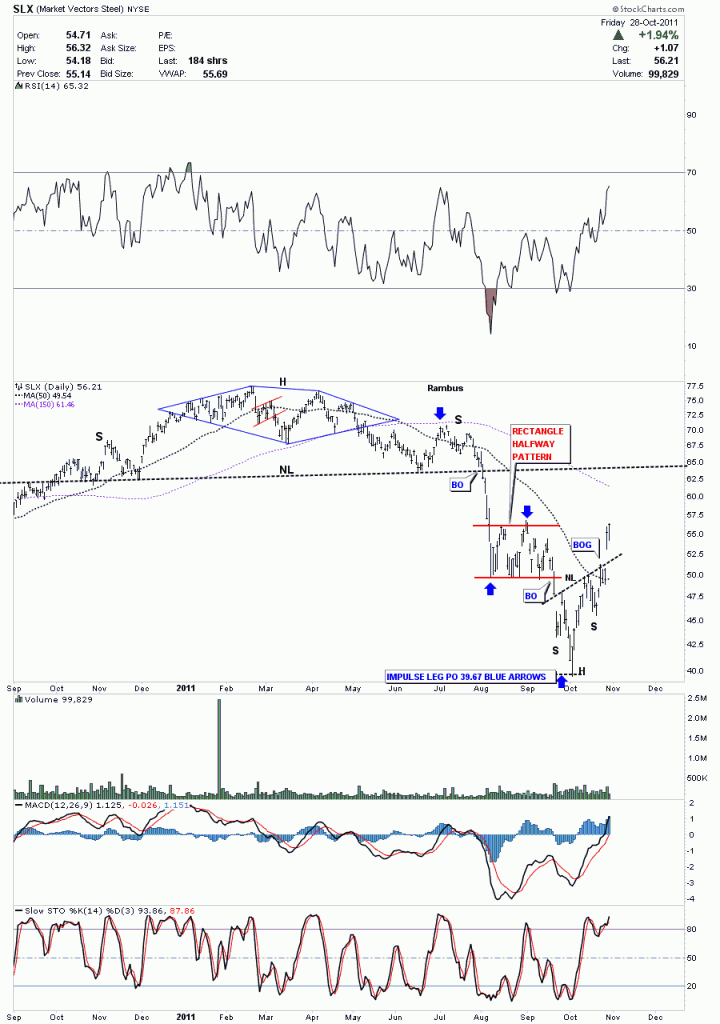
Lets take a quick look at a couple more commodities just to get a feel for the strength they have been displaying over the last month while the dollar was topping. The SLX looks at steel. If we are going to have a rebound in the economy steel will play an important role in the recovery.
SLX steel daily H&S bottom.
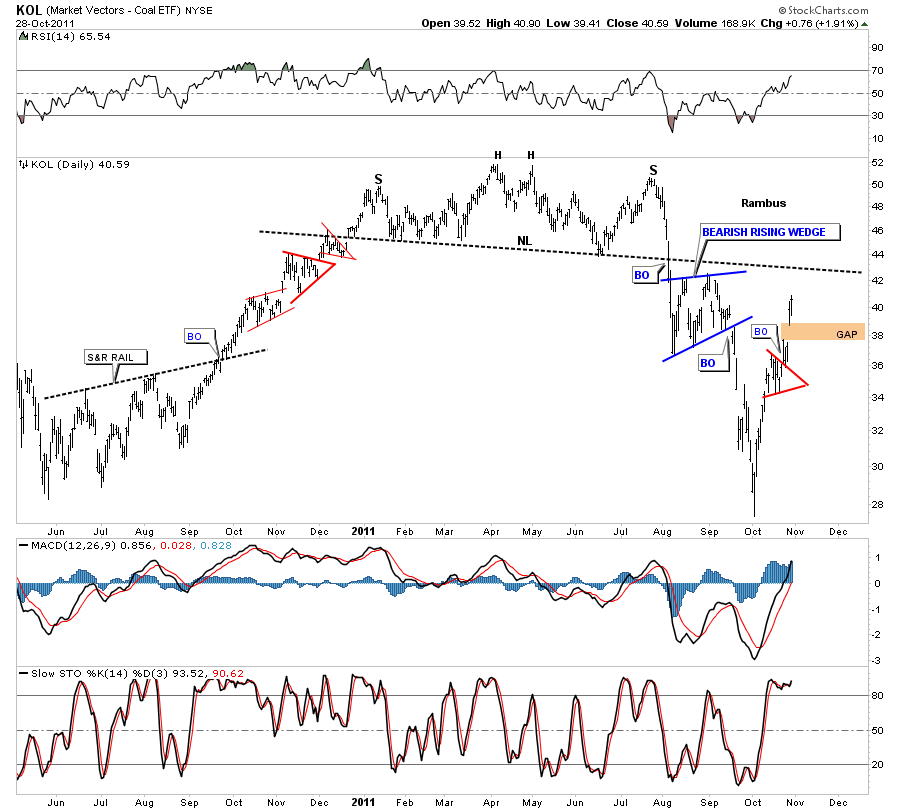
One last chart to show the strength in commodities. KOL is a coal etf. If you are going to have a pickup in the economies of the world coal will play a vital roll.
By looking at the above charts it sure looks like inflation is about to come to the for front and lead the commodities higher. I could have added precious metals to this inflationary scenario but I think you can see a falling dollar is going to put upward pressure on inflation, the stock markets and commodities, just as Gold and silver are suggesting after they have completed their most recent bottom patterns. So, the risk on trade is where its at right now and one should be trading accordingly.
All the best…Rambus

