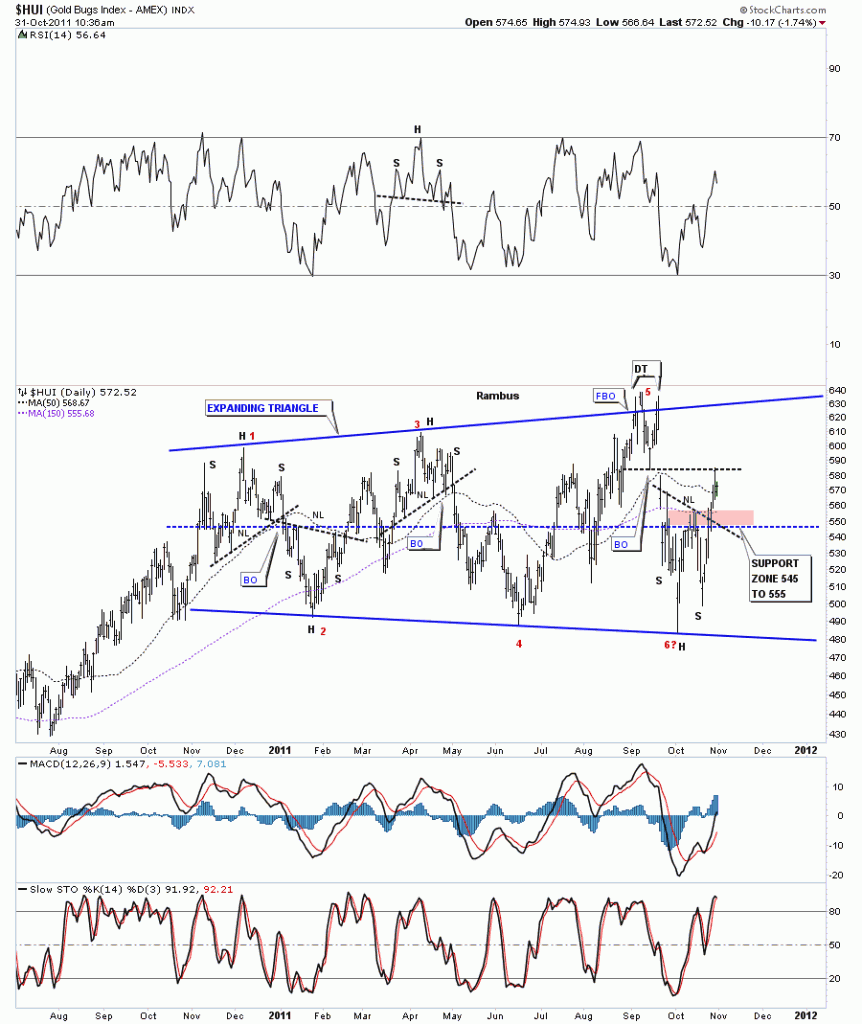
After last week huge run it stands to reason that its time for alittle profit taking by some traders. This is all normal price action. No matter how bad you may want it to be, the markets never go up or down in a straight line for very long before profit takers come in. Today’s daily chart of the HUI shows why we are getting some weakness. The last high made in September was a double top. There was a false breakout of the top rail and then another total reversal point was made all the way down to the bottom of the trading range. Getting back to the double top. Whenever you have a double top or double bottom the hump or the V is always a good place to look for support or resistance. In this case, the double top hump, is acting as resistance. As you can see last weeks rally stopped right at the bottom of the V of the double top. Today’s action is what you would expect on the first hit of that area. Now what we have going is resistance at the double top hump and support at the neckline of the H&S bottom. So we are probably going to do a little ping pong move between the overhead resistance and the neckline support area. I’ve labeled the support zone with a brown rectangle. This is important support to watch.
HUI daily support zone brown rectangle.

