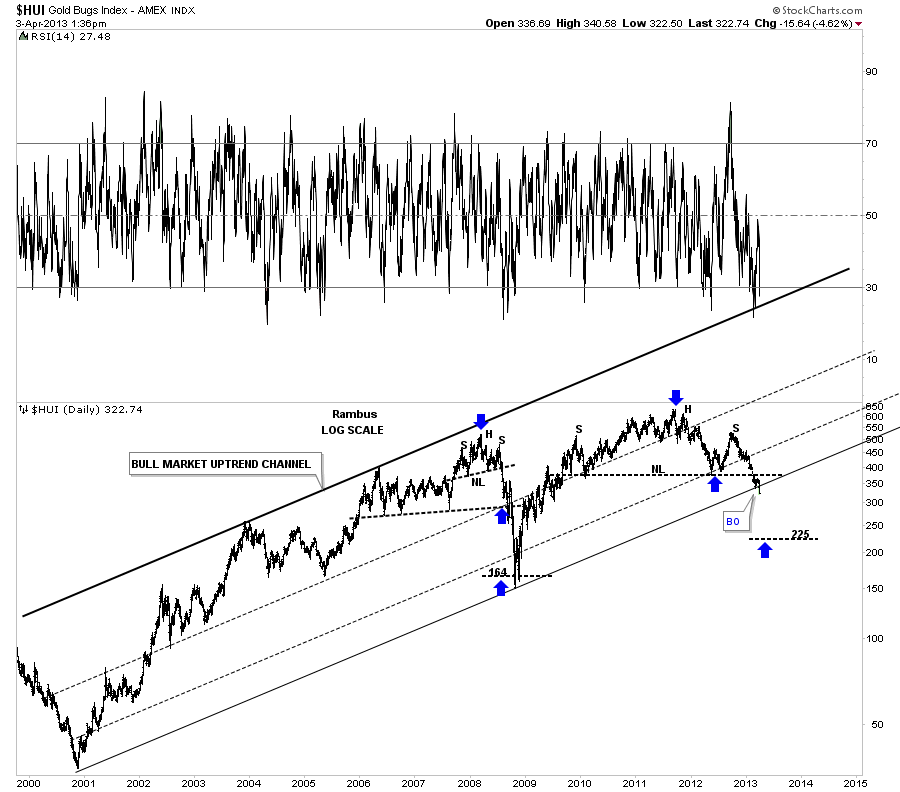
I just want to show you another reason for the big move down on the HUI today. Alot of goldbugs have been watching the bottom rail of the major uptrend channel that goes back to the beginning of the bull market in 2001. As you can see on the bar chart below, today the price action its breaking that all important bottom trendline. I suspect there are a lot of sell/stops just below that area getting taken out right now.
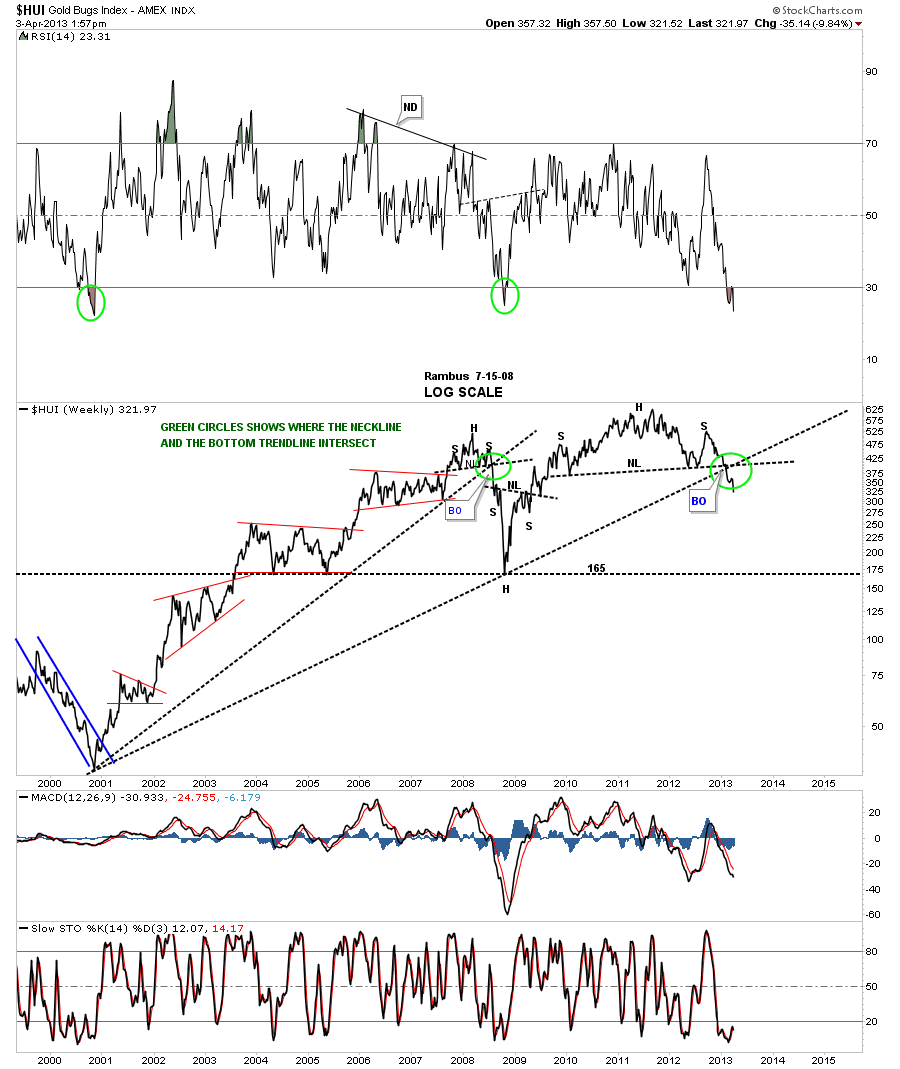
Below is a daily line chart that I have shown you several times already that told me several months ago the bottom rail of the uptrend channel was already broken but most chartists don’t look at line charts. The green circles shows us the similar setup to the 2008 H&S top, with the uptrend rail at the time, intersecting at the neckline. You can see we had the same setup at the beginning of this year. We could see a backtest at some point but no guarantee. Charting is about finding clues that add up to show the big picture and trend so one knows what side of the stock to trade.