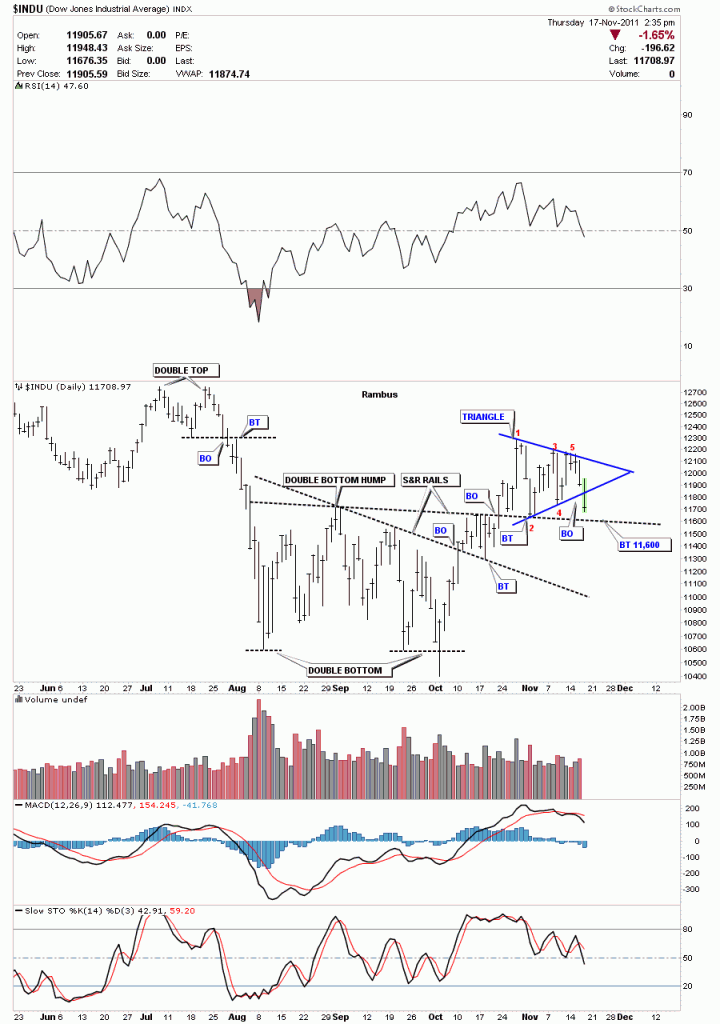
The Dow has clearly broken the bottom rail of the triangle strongly suggesting it is a reversal pattern. There is a S&R rail about 100 points down at 11,600 that will be the last area of decent support. A break of that rail will put the whole intermediate uptrend in question.
Dow daily triangle breakout.
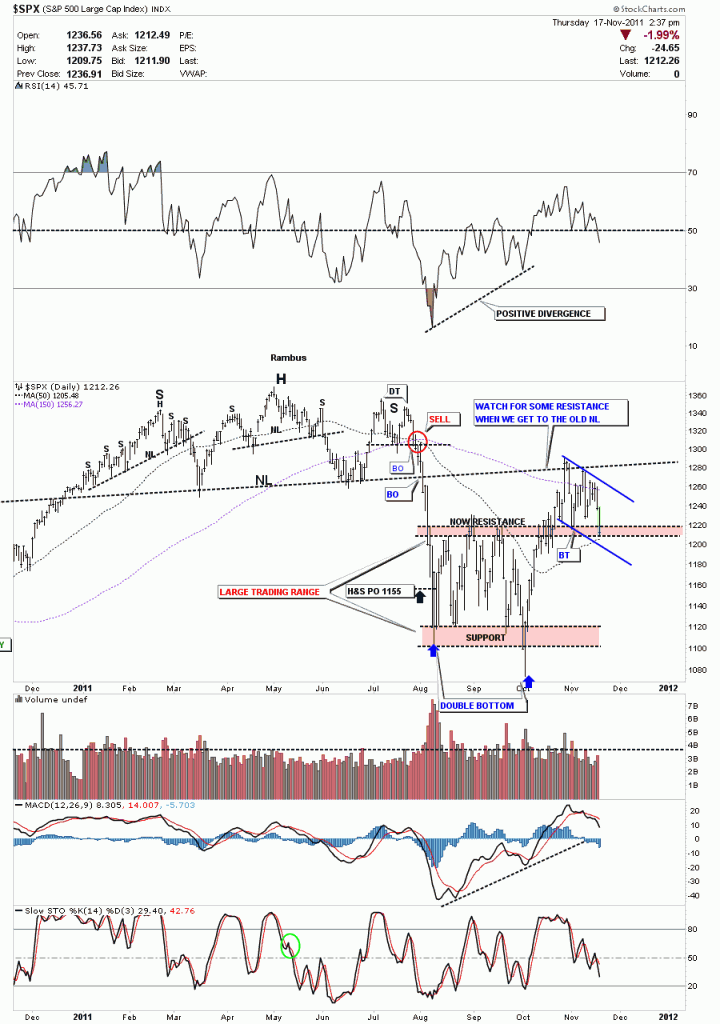
I want to show a daily chart of the SPX as it has a slightly different pattern. The brown area at the top of the congestion zone should theoretically act as support as it has done twice so far after breaking out above the resistance zone. You can clearly see we have been chopping between the big neckline from the H&S top formation and the brown area that was resistance and should now be support. The 50 dma comes in at 1205 just about at today’s lows.
SPX testing support, brown resistance zone, from the topside.


