Tonight I want to take an in depth look at the US dollar as it is so important to the overall big picture regarding the deflationary outlook that appears to be headed our way. There are just two pieces of the puzzle that need to come into focus and one is a strong US dollar and the other is a weak oil price. Everything else seems to be lining up. I have many different charts for the US dollar that are showing us nothing is broken and basically this consolidation area is still developing.
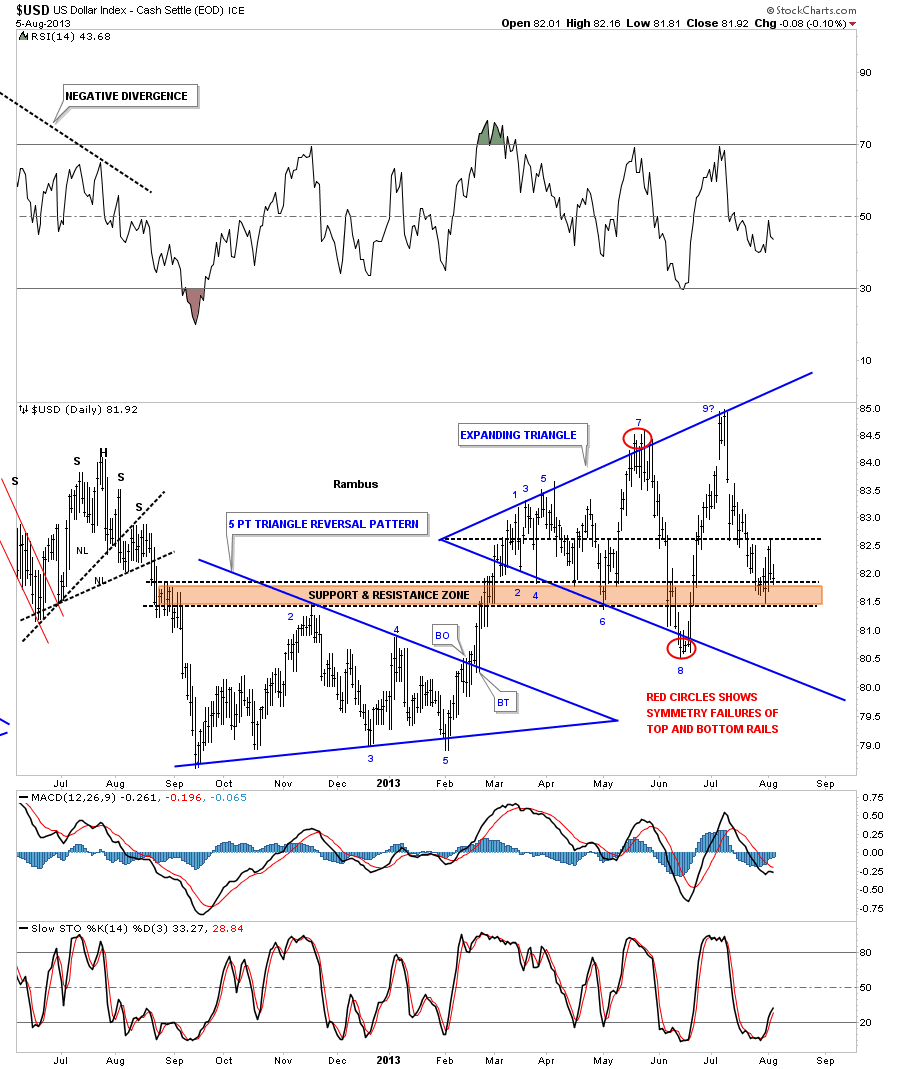
Lets start with a daily chart for the US dollar that I showed you a while back that shows an expanding triangle forming. Notice the brown shaded support and resistance zone that is made off the top of the blue 5 point triangle reversal pattern just below. As you can see this expanding triangle has been getting bigger so has the volatility been increasing. This is volatility to the max.
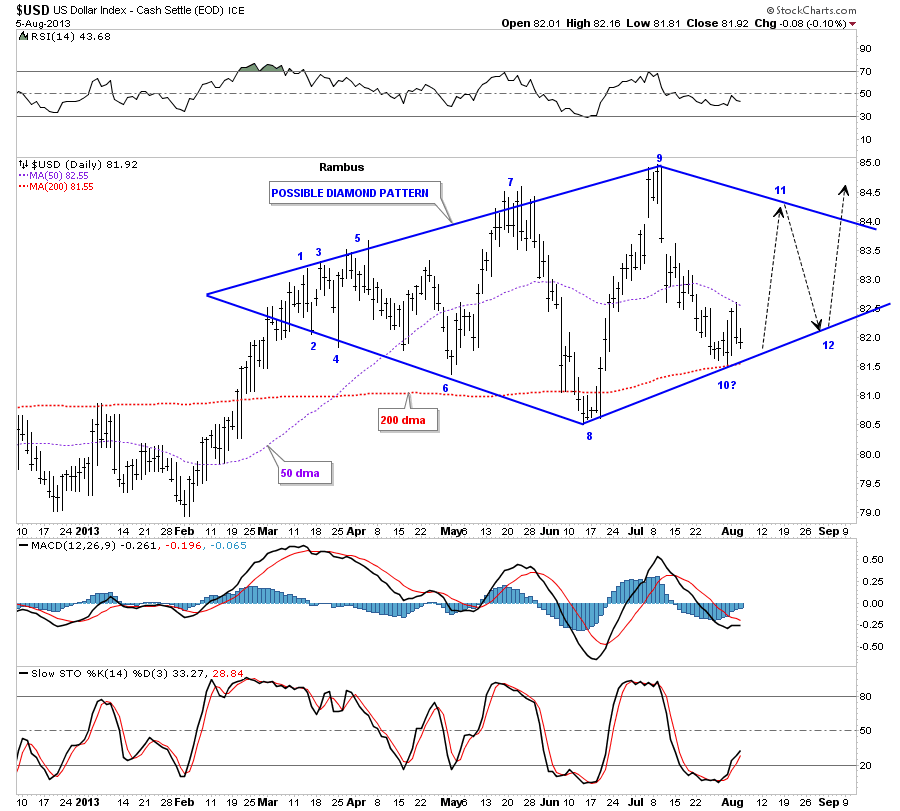
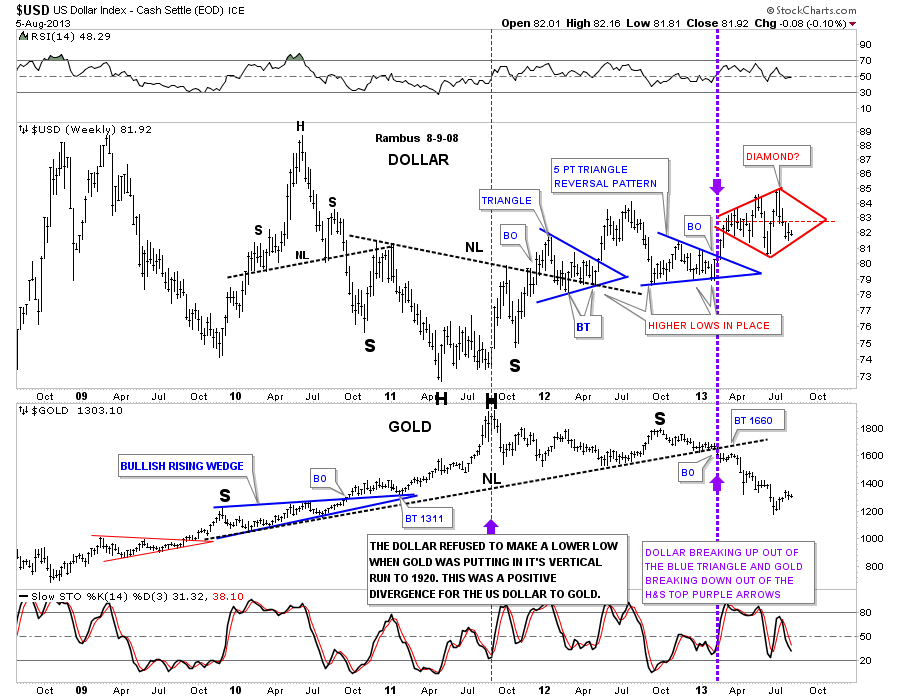
With this next chart I want to show you a possible pattern that came into focus last week when the price action failed to reach the bottom rail of the expanding triangle. Please keep in mind this new pattern is still far from complete yet there is now a potential that the expanding triangle is maybe morphing into a big Diamond consolidation pattern which is how diamonds tend to form, expanding on the left side and contracting on the right side. If last weeks low can hold, which is most important for this diamond pattern to form, then we can connect the bottom rail that will start the contracting process on the right side of the chart. As you can see last weeks price action bounced between the 50 dma and the 200 dma with the 200 dma holding support. So we are at a critical juncture for the US dollar right here and now. The top blue rail on the right side of the chart is just a parallel rail to the one on the bottom left side of the chart so it’s not firm. I expect some more chopping on the right side of the chart before the possible Diamond pattern can be completed. This possible Diamond fits in nicely with the longer term charts that are showing resistance at this point in time. Whenever you have a strong support or resistance many times a consolidation pattern will form just below a resistance rail, for example, that gives the stock enough energy to finally break through to the other side. I’ve added some black arrows that will give is a rough look at what I would like to see happen to finish off this most important diamond consolidation pattern to the upside.
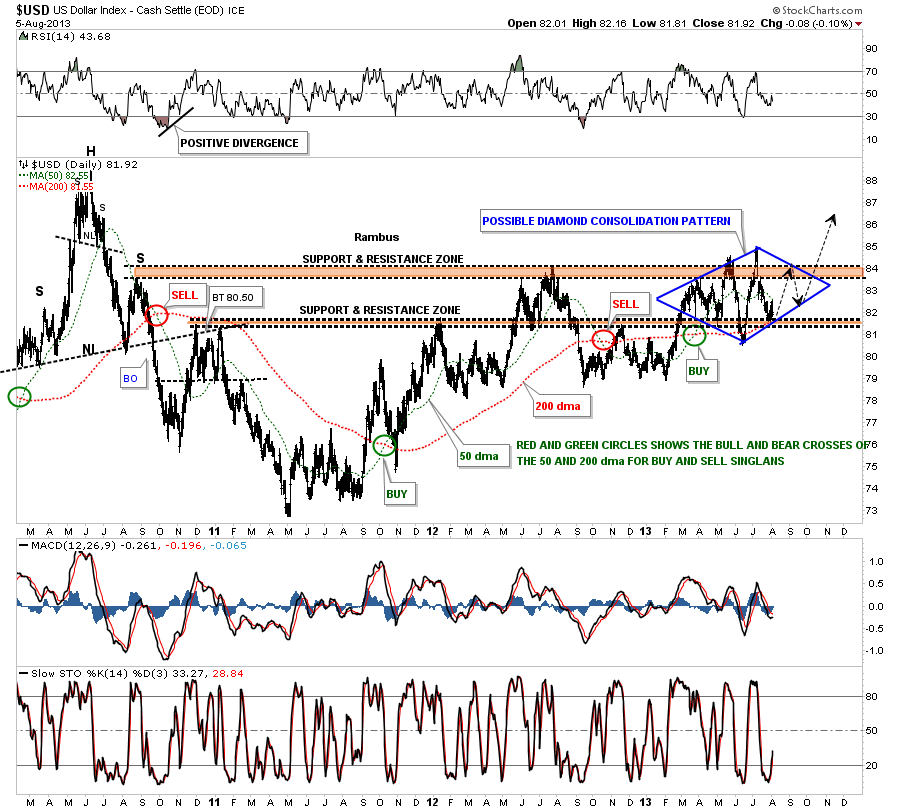
This next chart is a three year look that shows you two important support and resistance zones in the brown shaded areas. As you can see the top brown shaded support and resistance zone is still holding resistance. The lower support and resistance zone has been a little sloppy but the potential blue diamond has pretty much found support on top of the lower S&R zone. As you can see our blue diamond has formed between the upper and lower brown shaded support and resistance zones which makes sense if you think about it. Once the US dollar can overcome the top S&R zone it will then reverse its role and act as support from the topside. Also on this chart are the 50 dma and the 200 dma with their bull and bear crosses. So far the bull cross, in April of this year, is still intact.
Lets now go back further in time and look at a five year chart that shows that the US dollar has been in a nice confirmed uptrend channel for 2 1/2 years or so. Like the possible diamond pattern, that is forming on the daily chart above, you can see why this area is soooo important to hold support. I would really like to see our present low form just above the previous low made a couple of months ago giving us a higher low on the bottom rail of the uptrend channel.
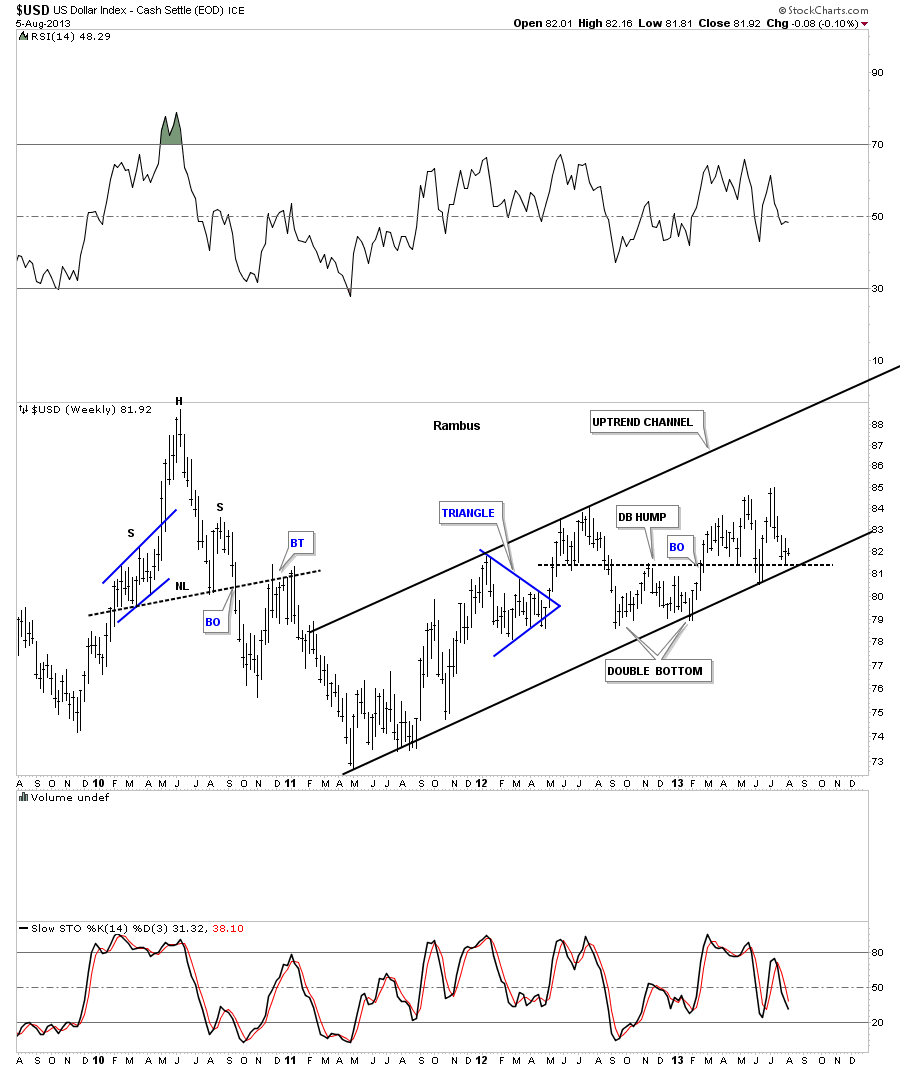
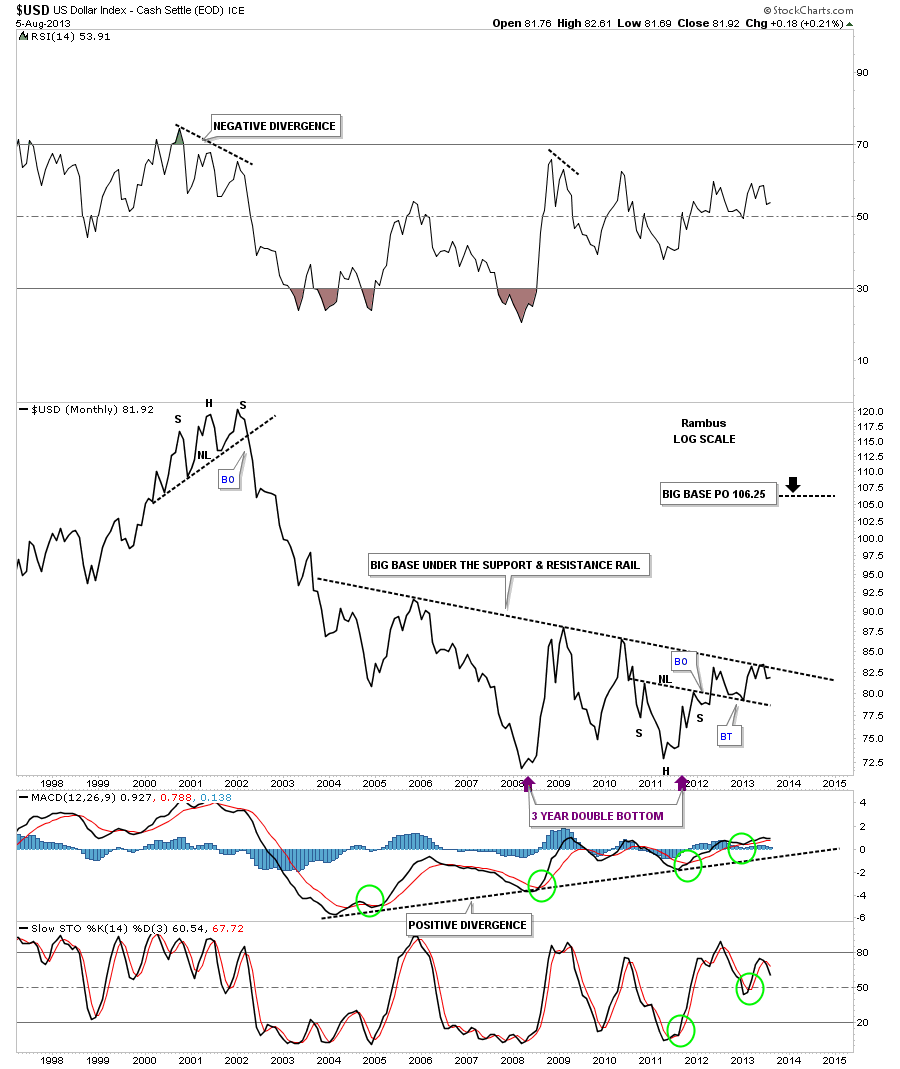
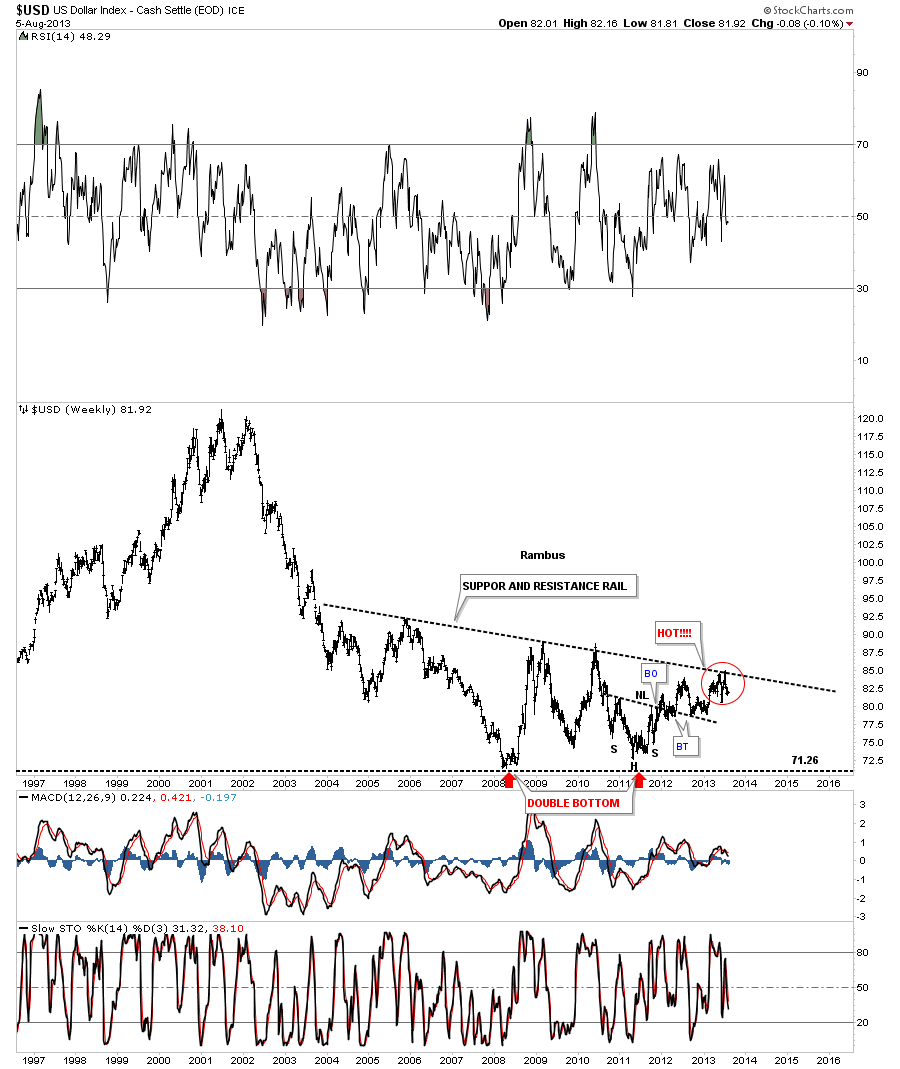
Below is a long term chart that shows the big base being built that will launch the US dollar much higher once the black dashed support and resistance rail is finally broken to the upside. As you can see the price action has touched the support and resistance rail several times now in the last few months. This is where the diamond, I showed you on the second chart above, is forming. I believe that diamond is going to give the US dollar the energy it needs to finally overcome that support and resistance rail. I also expect once the big S&R rail is broken to the upside there will be a backtest at some point before the US dollar rally takes off. The red circle shows the area I’m talking about
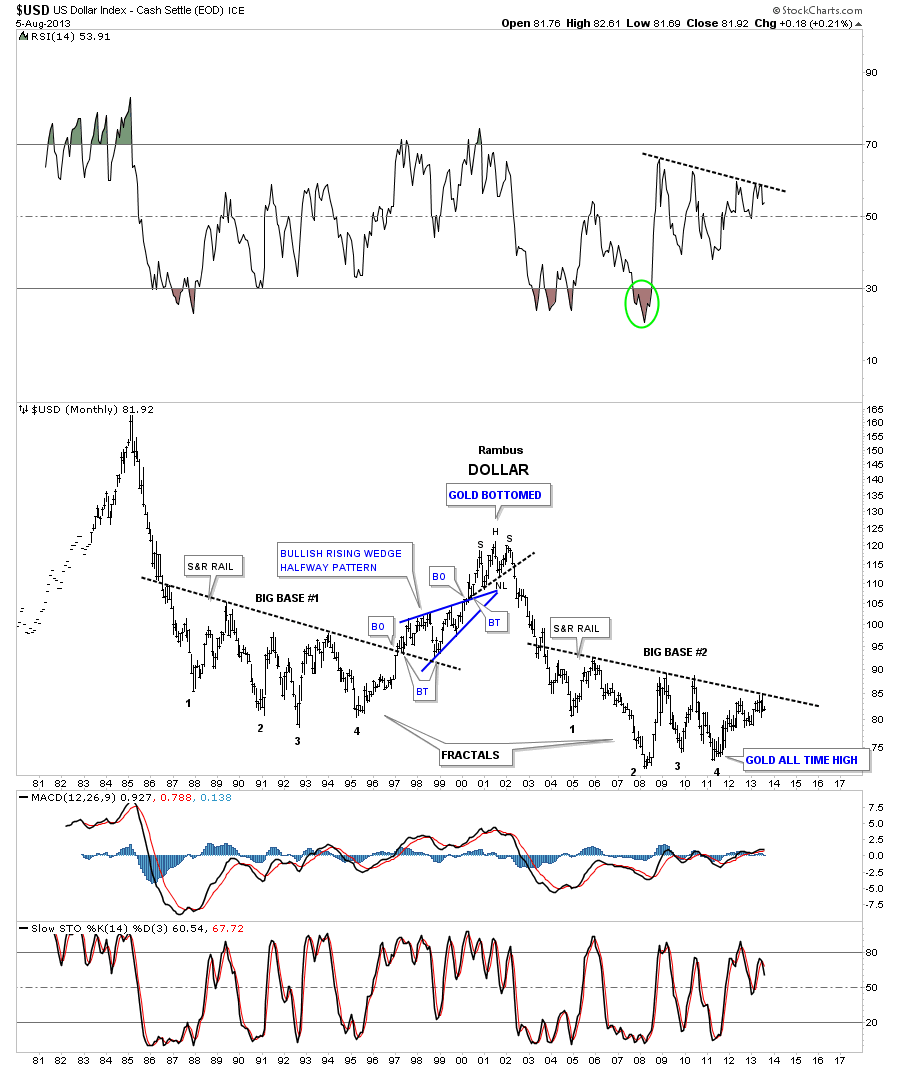
Below is a 32 year chart, that shows the bottom above is a fractal to the one that formed back in the 1990’s. A big base equals a big move.
Below is a combo chart that shows the US dollar on top and gold on the bottom. What strikes me first when I look at this chart is how the dollar has been consolidating while gold has been declining. If the US dollar can bounce off of this most recent low that should put a headwind in golds face. This is what I refer to as an inflection point.
The last chart I would like to show is a long term monthly look at the US dollar that is showing how the price action keeps testing the support and resistance rail. This is telling us that this support and resistance rail, on the monthly chart, is very very hot and once it’s overcome the big base will be competed. It lets us know where we are in the big picture which is one of the most important aspects of charting. You have to know where you are, relative to everything else, in order to make the best judgement call one can make. These charts should get everyone up to speed on what may lie ahead in regards to the precious metals complex and the deflationary episode that looks to be in front of us. All the best…Rambus