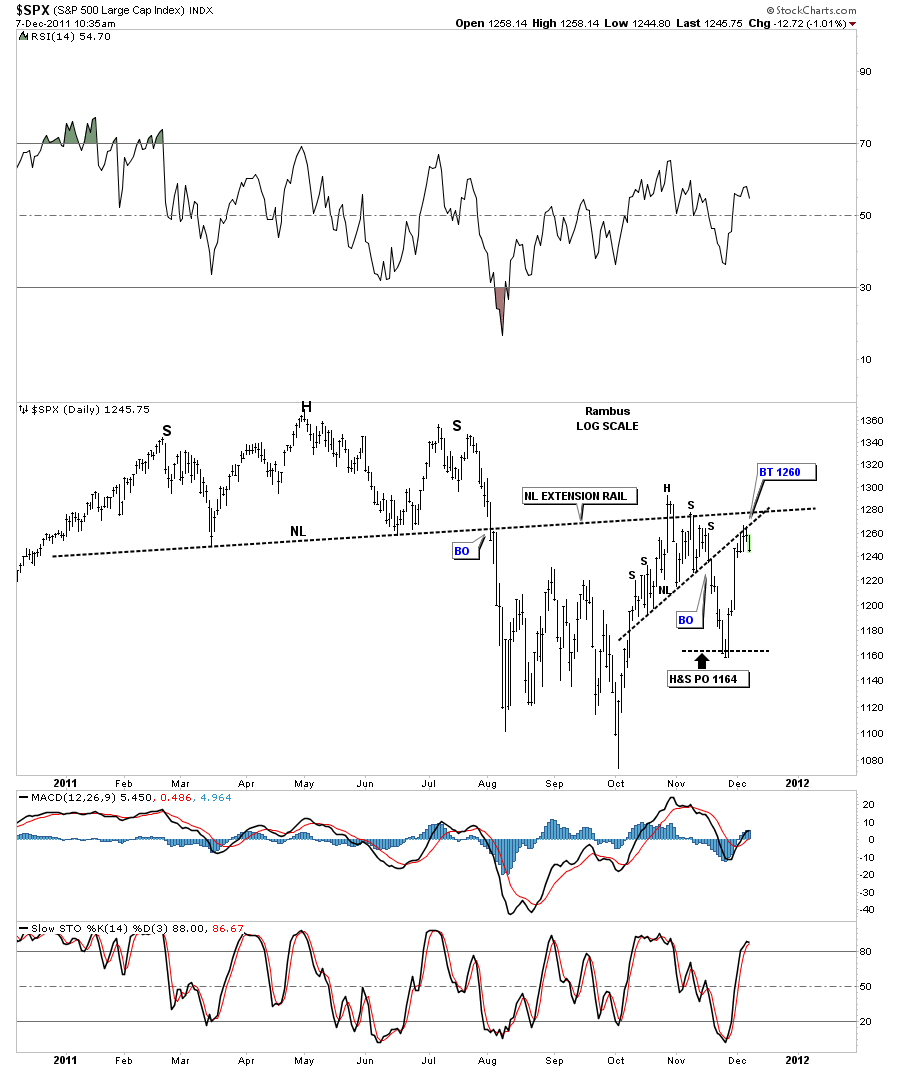
In the weekend report I showed a chart of the SPX with a H&S top that had broken down. The massive one day rally last week took the SPX all the way back up to the underside of the neckline. I said 1260 was critical resistance and the backtest to the neckline. This week we have been hanging around the bottom side of the neckline waiting for something to happen. Usually after about 3 or 4 days of little movement the price action will make some kind of move. As you can see on the chart below, today’s action maybe suggesting that the 1260 neckline resistance is hot so a sell/stop can be placed above the 1260 area if one decides to go short. There is also a neckline from the big H&S top that should also offer resistance.
SPX daily backtest to the neckline at 1260.
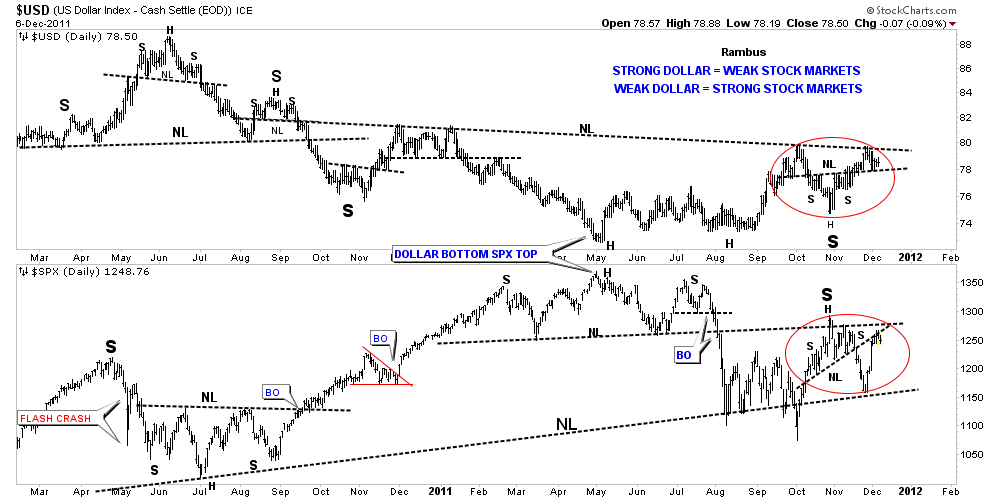
Below is the US dollar chart on top and the SPX chart on the bottom. This is the chart I showed in the weekend report. The red circles shows the inverse setup between the two. You can see how the US dollar is backtesting it’s neckline while the SPX is backtesting it’s own neckline. Just a side note. Until the dollar can break through the neckline don’t expect alot of action. Once the breakout and backtest are finished is when the next impulse leg up will start. So watch those two necklines very carefully. If your an aggressive trade you can start a small position as close to 1260 as possible and can then add as the dollar breaks out and backtests.
US dollar chart on top and the SPX on the bottom. Red circles shows inverse look.


