
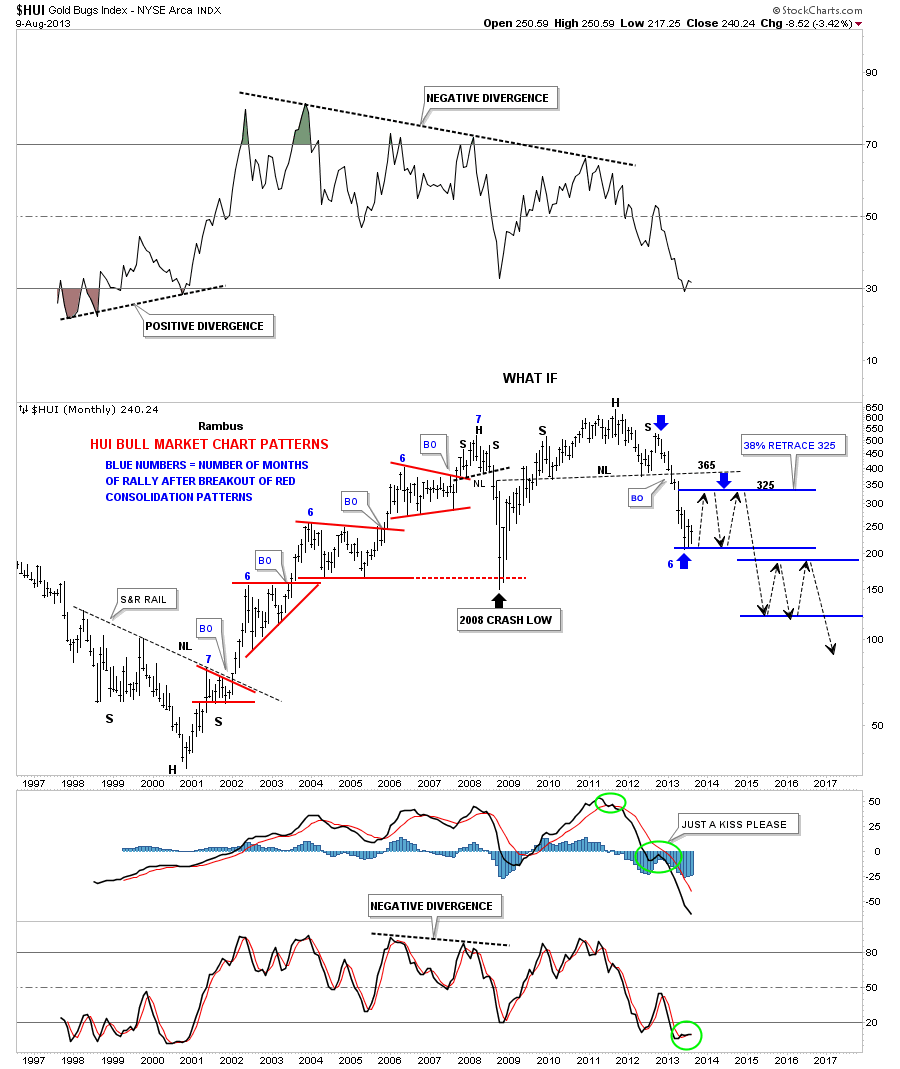
In this Weekend Report I would like to show you a “WHAT IF” scenario that few are seeing at this time. There are two major camps in the precious metals complex, the bulls and the bears. The bulls are looking at this most recent low as THE BOTTOM and a new bull market is being born. They have been crushed all the way down from last falls high on the HUI calling every small bottom THE bottom. On the other hand you have the bears that either got out or have been riding this almost one year decline, short the precious metals complex, and looking for more blood to the downside, to that all important 2008 crash low around the 150 area on the HUI. I have been in the bear camp since the first of December of 2012 until last week. Even at the beginning of last week I was still looking for lower prices for the precious metals complex. If you have been trading long enough you know the markets can change on a dime and when you start to see important trendlines begin to fail that changes everything no matter how bullish or bearish one may be.
Our logo at Rambus Chartology is a Golden Chessboard that represents how the markets are like a chess game. One needs to be thinking two or three steps ahead of the “WHAT IF” possibilities that can occur. Even though I’ve been bearish the precious metals complex since last December I’m always looking for, What If, the trendline breaks or what if this is a false breakout, or what could change my way of thinking, always keeping an open mind for any possibility. Its harder to do than most think as one can become ingrained into the trend and not see the forest for the trees.
In this Weekend Report I would like to show a possible scenario that makes the most sense to me right now based on the previous price action the HUI has shown in the past. As I have stated many times the bull market in the HUI, also gold, was one of beauty and symmetry that is still going on to this day. They have been a chartists dream come true for identifying important chart patterns in which to trade off of. I would like to start out with a daily chart for the HUI and work our way out to the possible scenario I see as a strong possibility going forward.
The first chart I would like to show you is a daily look at the HUI that goes back about a year and a half. Some of you may remember that small double bottom that formed in the summer of 2012 that looked like it was going to launch another leg up in the bull market for the HUI. There are several ways to draw a double bottom trendline. Most just draw a horizontal trendline off the double bottom hump to the right side of the chart and when the price action breaks through, the double bottom is complete. I have found, through many years of charting, that a double bottom or double top trendline can be slanted which can give you a better price objective depending if you have something to connect the double bottom hump on the left side. When you have a double bottom where both bottoms are at the same price its easy to get a price target. You just measure from the double bottom hump to the double bottom low, add that distance to the breakout of the double bottom trendline, to get your price objective. Many times a double bottom will have one bottom slightly higher than the other which makes it a little harder to measure a price objective. The conservative way is to measure from the higher low of the double bottom, to the double bottom hump, and take that measurement and add it to the breakout point to get your price objective. Keep in mind a double bottom can go much higher than the price objective. The main take away from this double bottom is that it is reversing the downtrend that has been in place for almost a year now. Also note our most recent possible double bottom still hasn’t broken through the double bottom trendline yet to confirm the bottom is in so it’s still a work in progress.
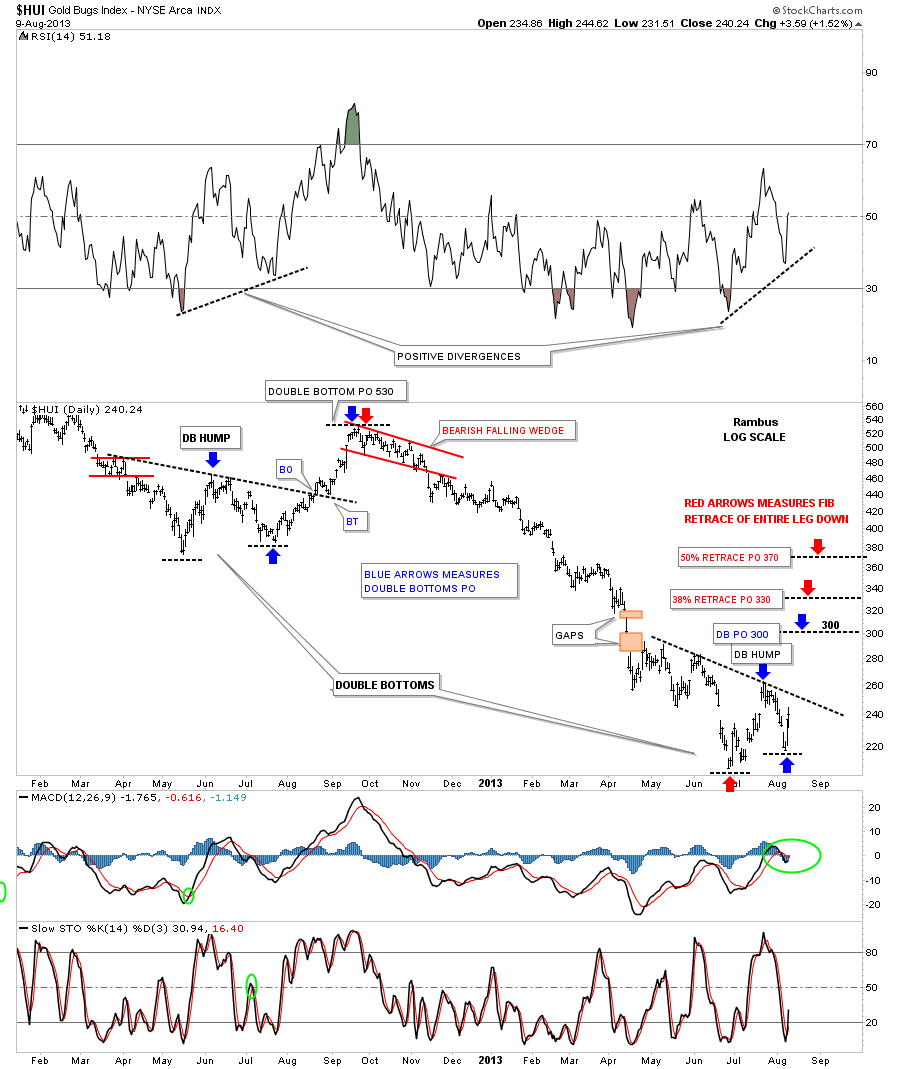
This next chart is very busy but I want to show you why our possible double bottom, on the chart above, is sooo important for the bigger picture. I’ve had this next chart for many years which I use for Fibonacci studies. There is definitely something to using the Fibonacci ratio’s when looking for support and resistance points. As this chart is so busy lets start on the right hand side of the chart because that is the most import area to focus on at the moment. If our possible double bottom is in place we can now add in some Fib retracements and see what shows up. There are two tops we can start the Fib tool, the H&S top and the top for the right shoulder as both of those legs were impulse moves. Lets start with the blue arrows that measure the distance from the H&S top to our current low. As you can see we get a 38% retrace to 365 which is all the way back up to the big neckline. Now if we use the right shoulder top as the starting point the red arrows shows a 50% retrace that also comes in at the 365 area where the neckline resides. The green arrows shows us where a 38% retracement comes in at the 330 area. The brown shaded area will give us a zone to shoot for if this What If scenario starts to play out. You can see why this potential bottom is very critical to the bigger picture which I will show you a bit later.

As I stated earlier there is a lot of information on this chart so we’ll look at it again. Lets keep working our way to the left side of the chart and look at where the purple arrows are located. The two purple arrows on the left side of the chart measures the last two impulse legs up into the 2008 H&S top. So what’s so important about that? If you take your fib tool and measure the distance between the two purple arrows, that formed the two impulse legs up into the 2008 H&S top, without changing the settings, grab your fib tool and move it over to the right side of the chart then place the top rail on the top of the massive H&S top and see where the bottom rail of the fib tool rests. It rests right on our current low. We are reversing symmetry down. If this double bottom is the real deal we have just reversed the two impulse legs up into the 2008 H&S top with our own two impulse legs down to our current low at 206. Pretty amazing.
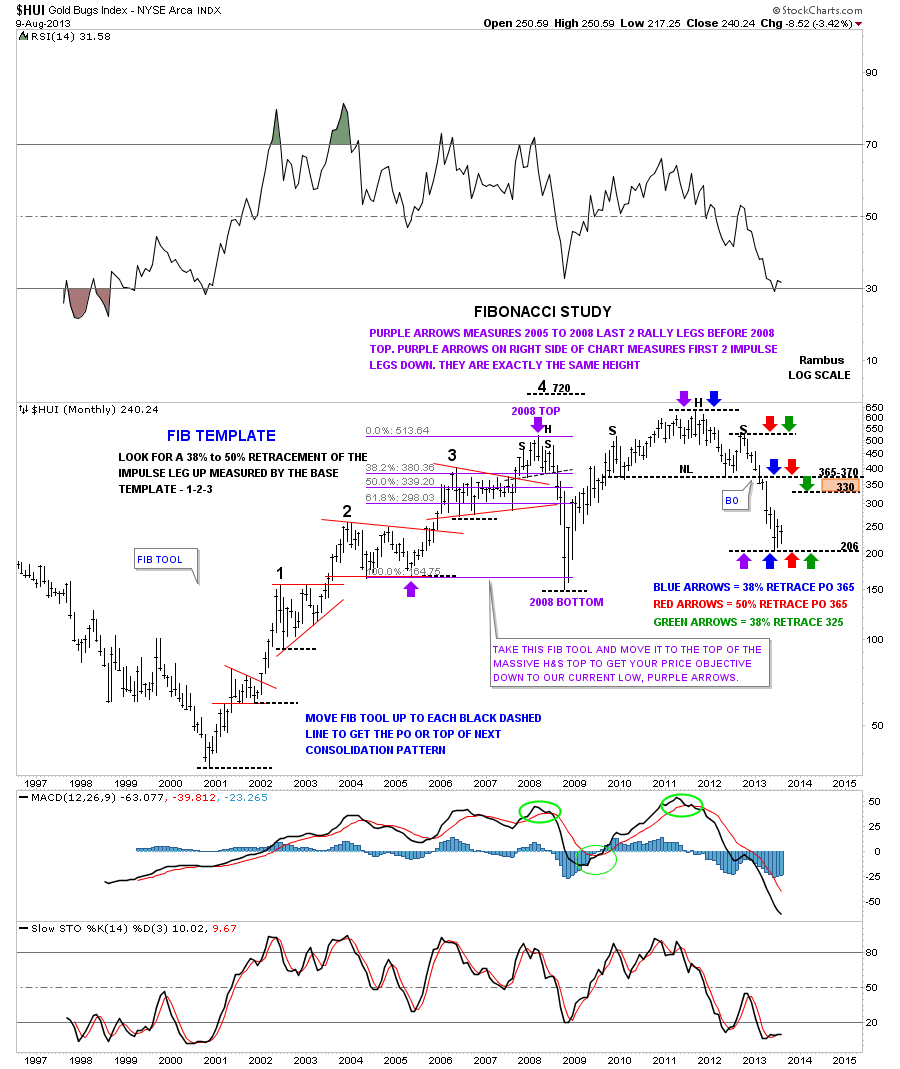
Before we move on there is still some critical information on this chart that needs to be discussed so lets now move over to the far left side of the chart that shows, what I called at the time, a Fib Template. I’ll try my best to describe what the Fib Template was and why it was so useful back in the bull market years. For those that have access to charting tools you will be amazed at how the Fib Template worked in both showing you where the next top was going to be and then showing you where to look for a Fib retracement once a top was confirmed. As you can see on the chart below the Fib Template is set in blue and measures the first two impulse legs up. As you can see it shows the consolidation pattern #1 had a 50% retrace off the bear market bottom at 35 or so. I will post this chart right now so you can see what I’m taking about and then I’ll move the Fib Template up to the next black dashed line so you can see the next price objective.
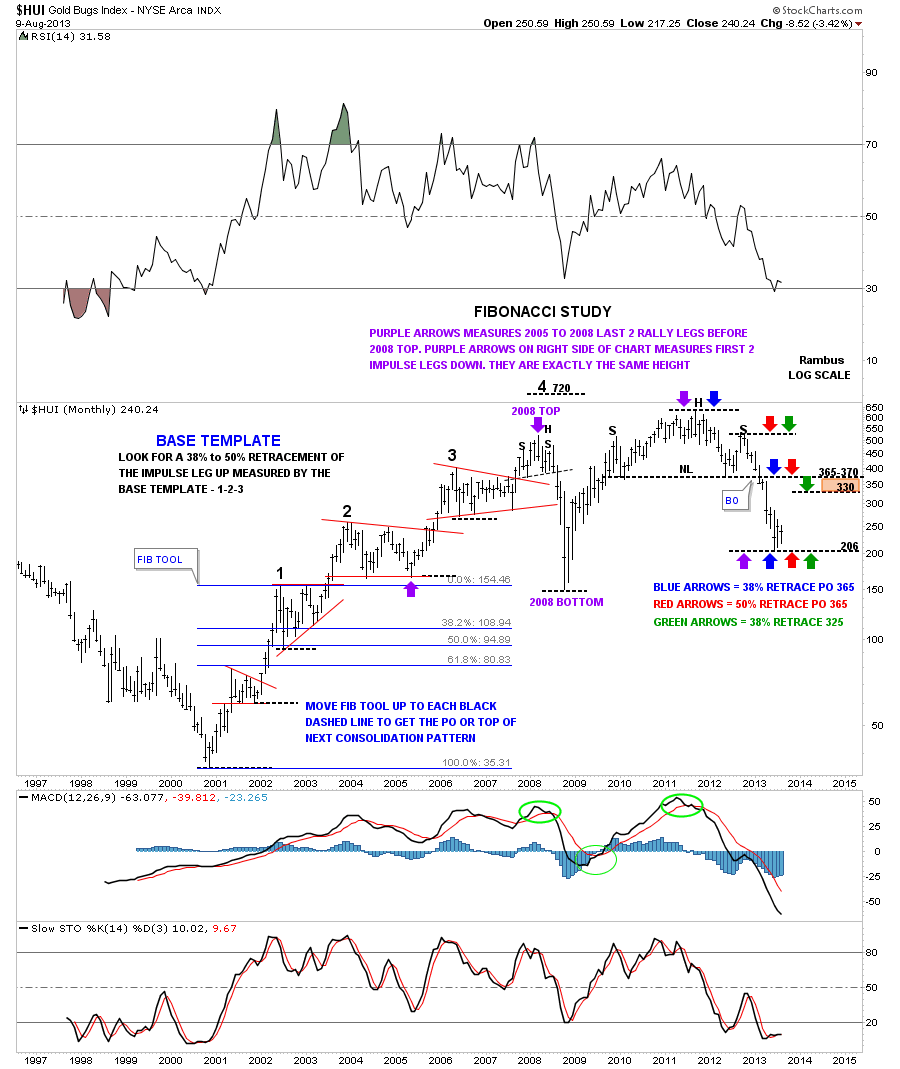
Now I’m going to move the Fib Template up to the next black dashed line so you can see how it measured out the next consolidation top at #2. Also notice there was a 50% retrace in consolidation pattern #2.
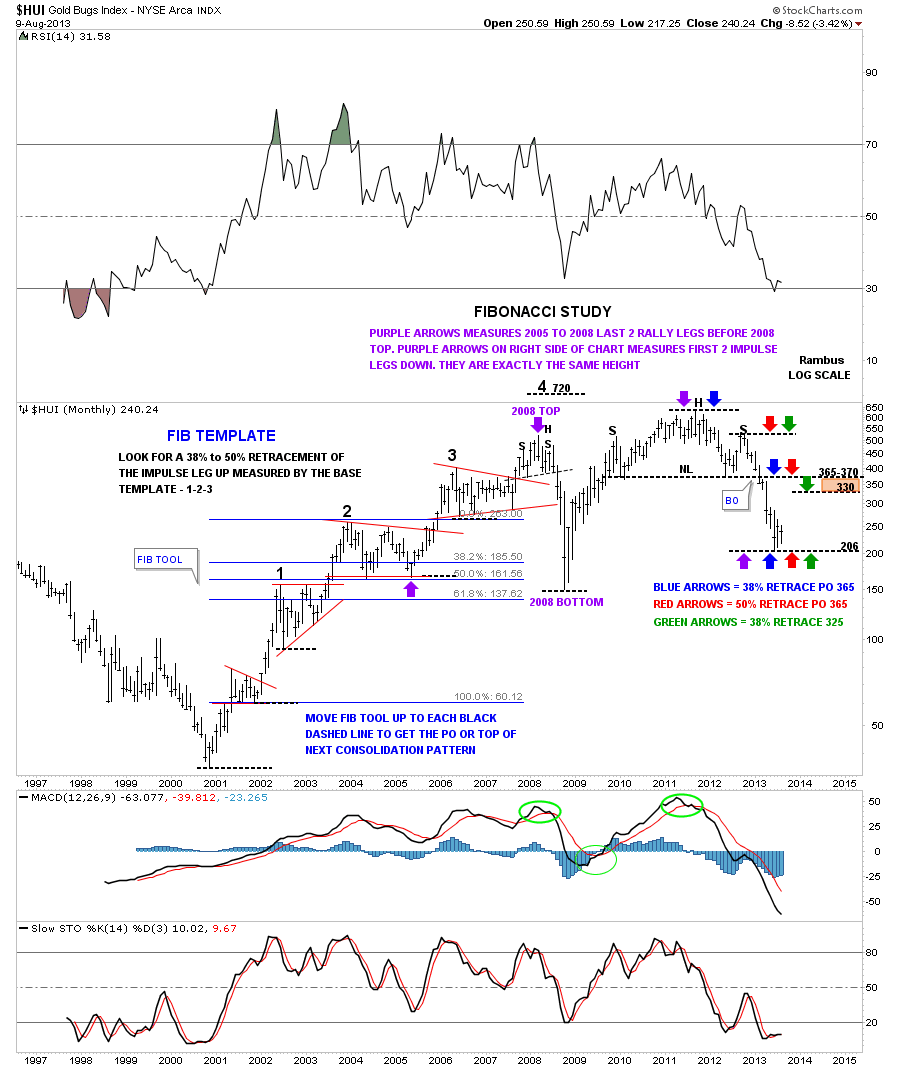
I’m going to move it up one more time so you folks that don’t have access to a chart service can see what is happening. I’m now at the third black dashed line where the Fib Template gives us a price objective up to the top of red triangle at #3. As you can see that triangle #3 has a strong 38% retrace before it broke out to the upside.
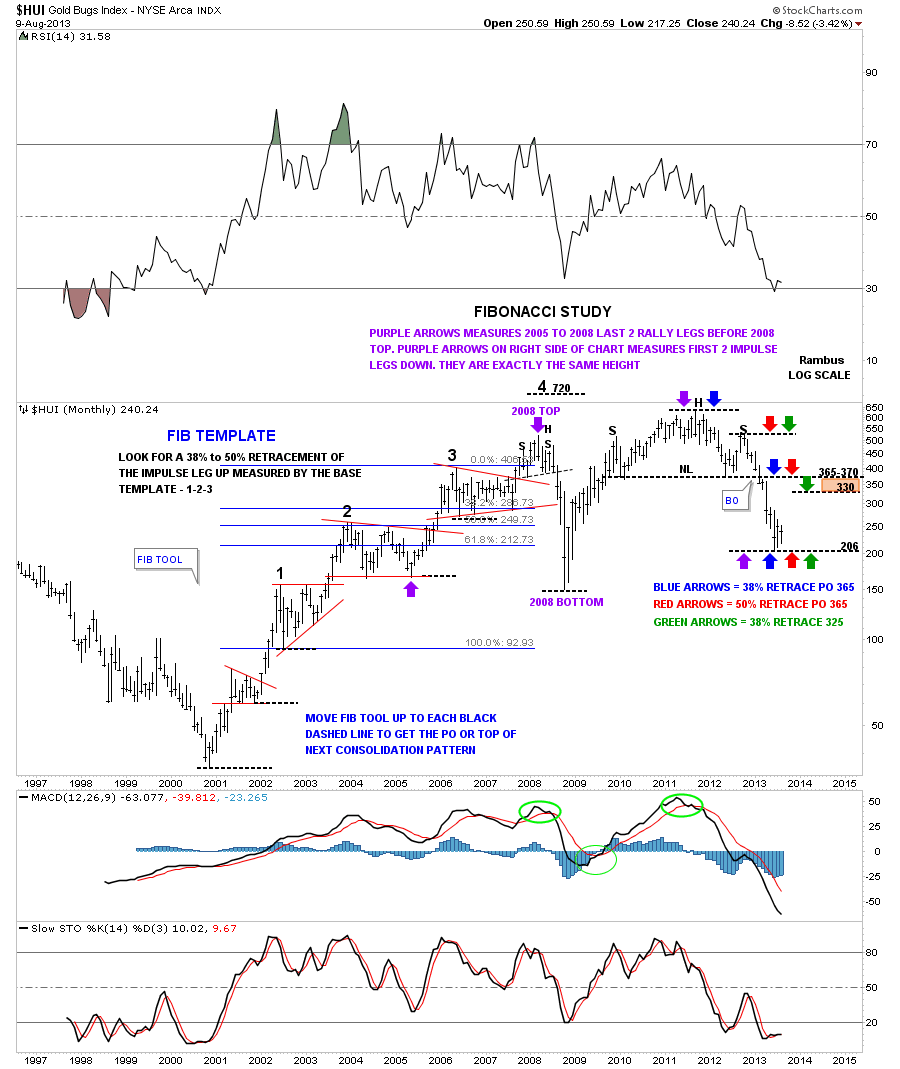
That was the last time the Fib Template worked like that. As you can see the next price objective in line was for the HUI to move up to 720 or so which I thought at the time had a good chance of happening. Keep mind we had just broken out of the fourth red consolidation patterns since the beginning of the bull market. I know many of you know how bullish the precious metals complex was at that time. It was hard not to be a bull. As you can see the HUI ran out of gas before hitting my 720 price objective and started to chop out that infamous 2008 H&S top. Even though I was as bullish as the next gold bug, I was still able to see the H&S forming and what might happen if it completed. The rest is history they say. The takeaway form this Fib Template was, more than anything, it showed you where a retrace low may occur after the top was put in place. Those were some long drawn out consolidation patterns if you remember. For those that have a Fib tool you can also measure each individual impulse leg up between each consolidation pattern and get a Fib retrace.
Now lets get into the What If part of this post. The reason I’ve been showing you these fib retracements is because I believe they are going to play an important role as we move south in the precious metals complex. This next chart shows how I think this bear market may unwind over the next year or two. As you know nothing goes straight down and the markets have to pause and refresh themselves before they can begin their next impulse leg. Again if we are putting in a bottom, on the daily chart above, we should have a decent rally just ahead of us. I don’t believe it is the start of a new bull market as there is a massive H&S top in place that is going to need time to play out. We have been in an impulse leg down in the precious metals complex for close to a year now. That has been close to the max for an impulse leg up in the HUI during the bull market years if you count from the last reversal point in those red triangles. What is interesting is that once the breakout occurred it took roughly six months to reach the top of the next consolidation pattern. As you can see on the chart below our impulse leg down from the right shoulder high is just shy of of one year. If you count the number of months since the HUI broke below the neckline we are right in that area, six months, to complete this move lower for now. A rally up to the 38% or 50% retrace seems like a possible scenario that will be the part of our next consolidation pattern. These won’t be as fun to trade as an impulse leg but with a little Chartology we will be gearing for a trading range mentality trying to catch the swings within the consolidation zone.
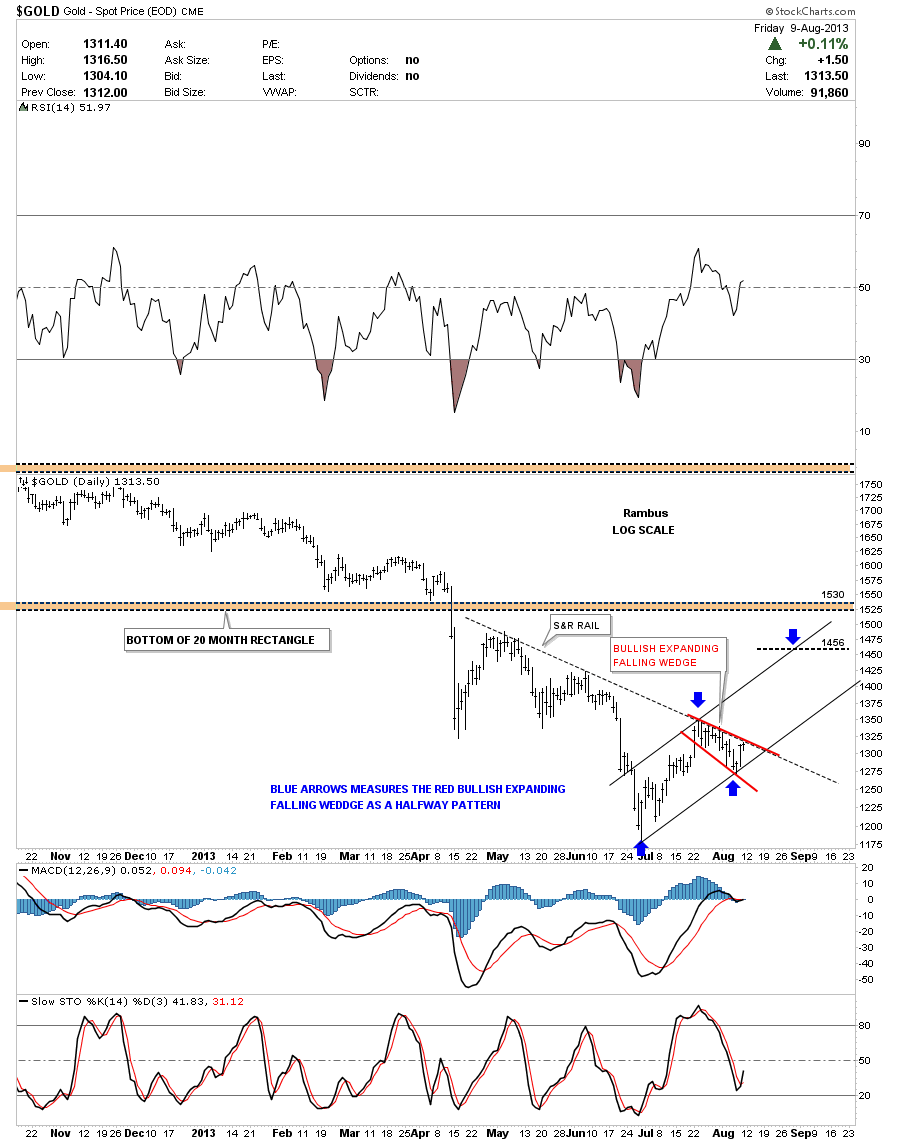
Lets take a quick look at gold that is showing a possible bullish expanding falling wedge as a halfway pattern up to the 1456 area. The bottom of that 20 month rectangle will be like a concrete ceiling if gold can make it that far.
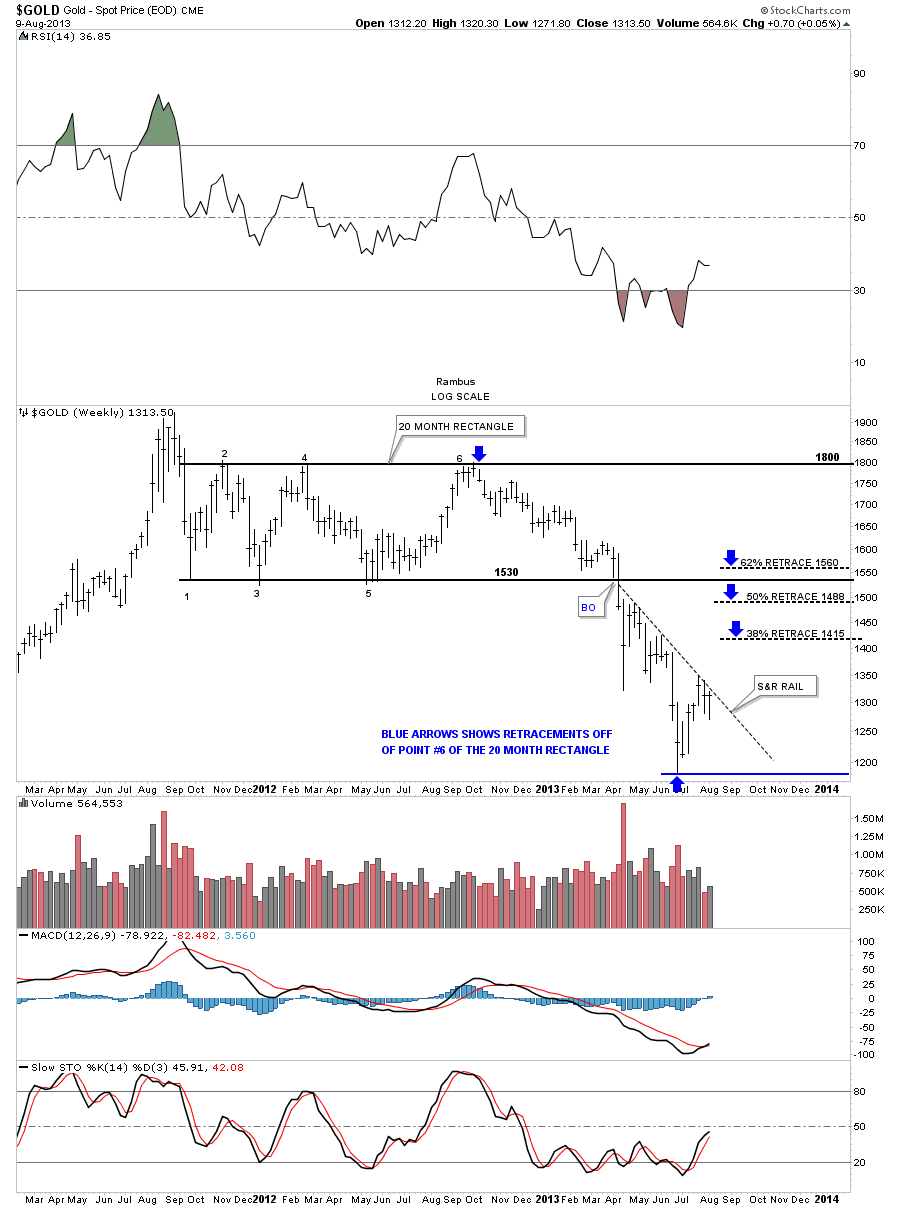
Below is a weekly look at gold that shows where the important fib retracements may come in play.
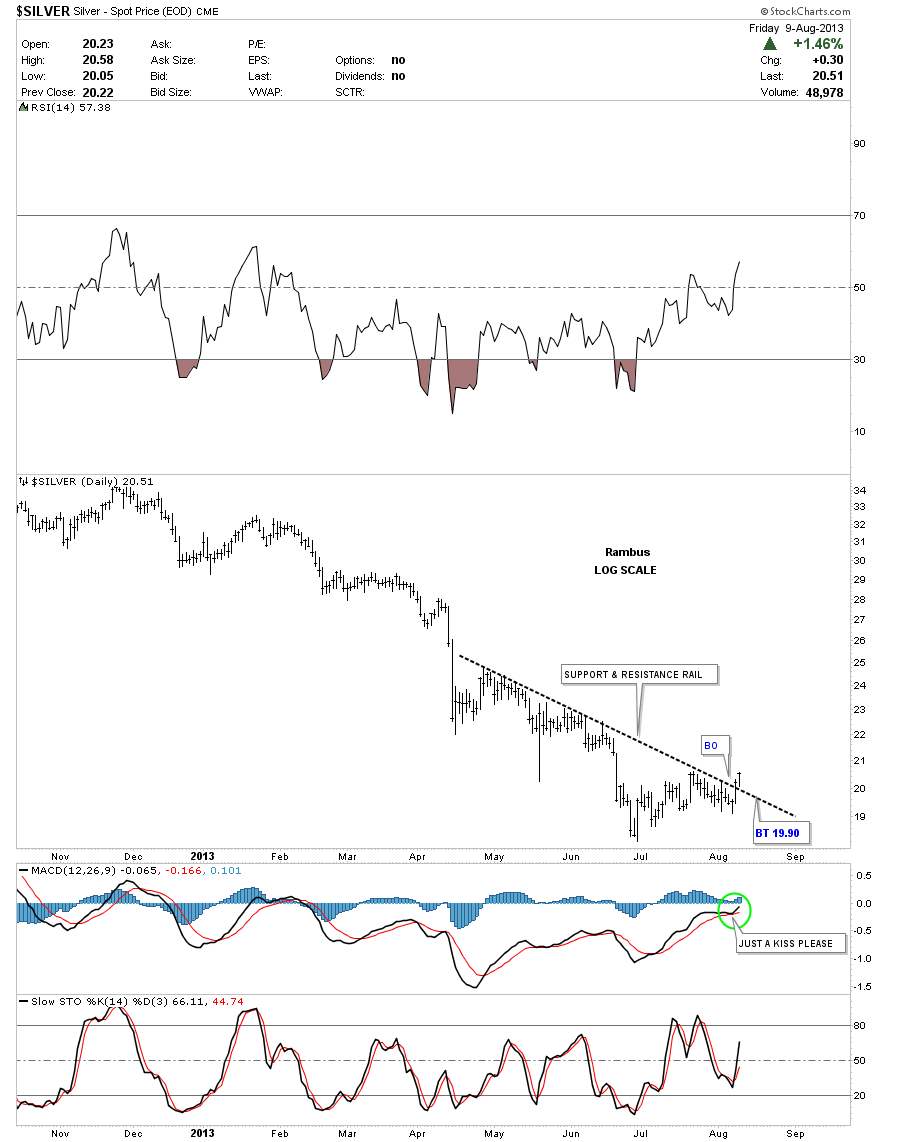
Silver has broken out above its support and resistance rail. This is an important development IMHO. You can see all the touches that occurred during its formation. It may backtest the S&R rail before it moves higher. Below the support and resistance rail is bearish and above is bullish.
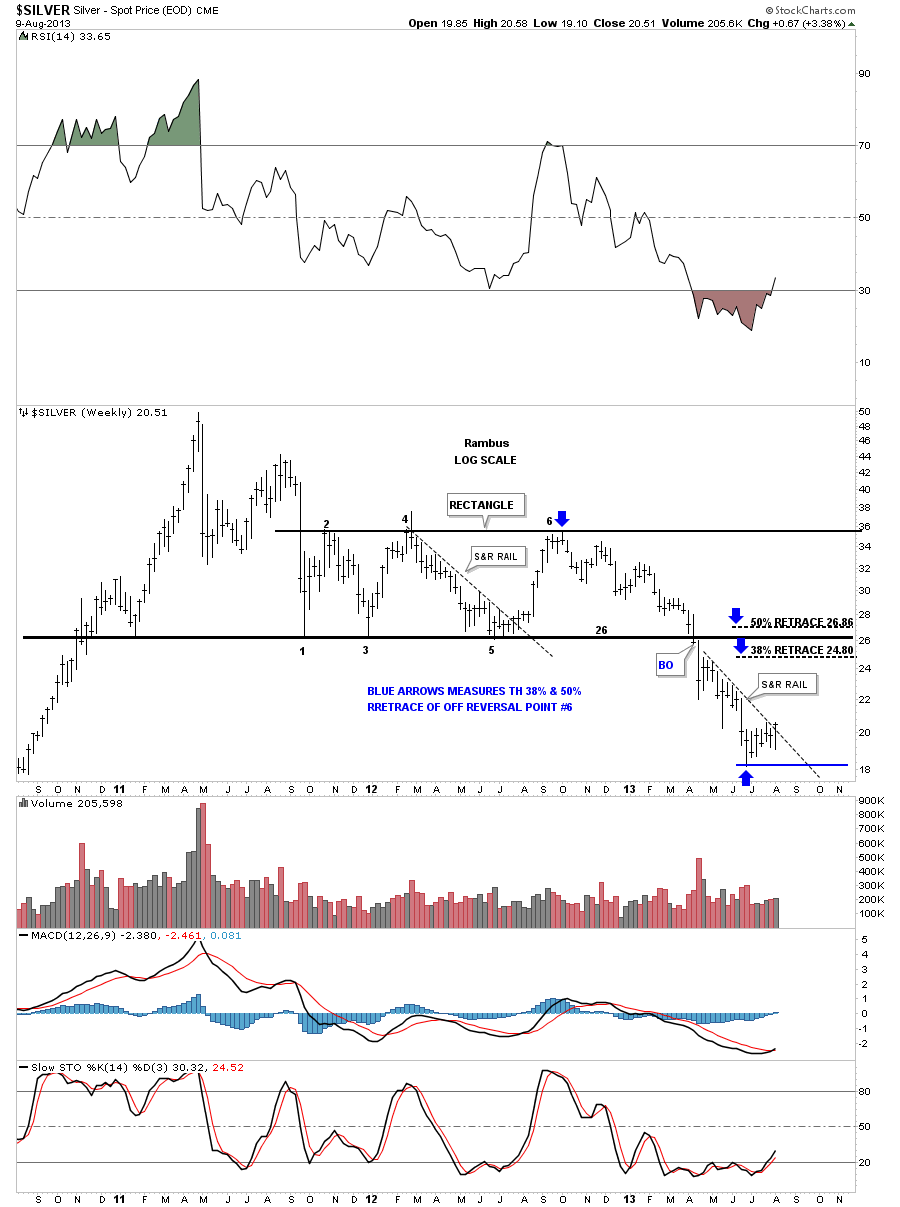
The weekly look at silver shows the Fib retracements. Again, like the bottom rail on gold’s 20 month rectangle silver to has a very large rectangle where the bottom rail should be very tough resistance if it makes it up that high.
The big question is, What If, this scenario plays out? It means we will be in a trading range for probably many months chopping out some type of consolidation pattern that will be recognizable when it’s all finished. Right now we are just working on reversal point #1 with 2, 3 and 4 to go before a consolidation pattern can be completed. This is nothing to fear but an opportunity to put on our trading hats and trade the boundaries of whatever type of consolidation pattern presents itself. These trading ranges can be very profitable if done right. The first thing is to recognize the possibility of a trading range as soon as possible by looking for reversal patterns within the the top and bottom of the trading range. This is why our potential double bottom carries so such weight. It could be our very first clue that a decent trading range is starting to develop and with the fib retracements we should get close to finding a topping pattern when the HUI closes in on one of the retracements. All we can do is wait and see what happens over the next week and see what clues the HUI will gives us as to the direction she wants to go. All the best…Rambus