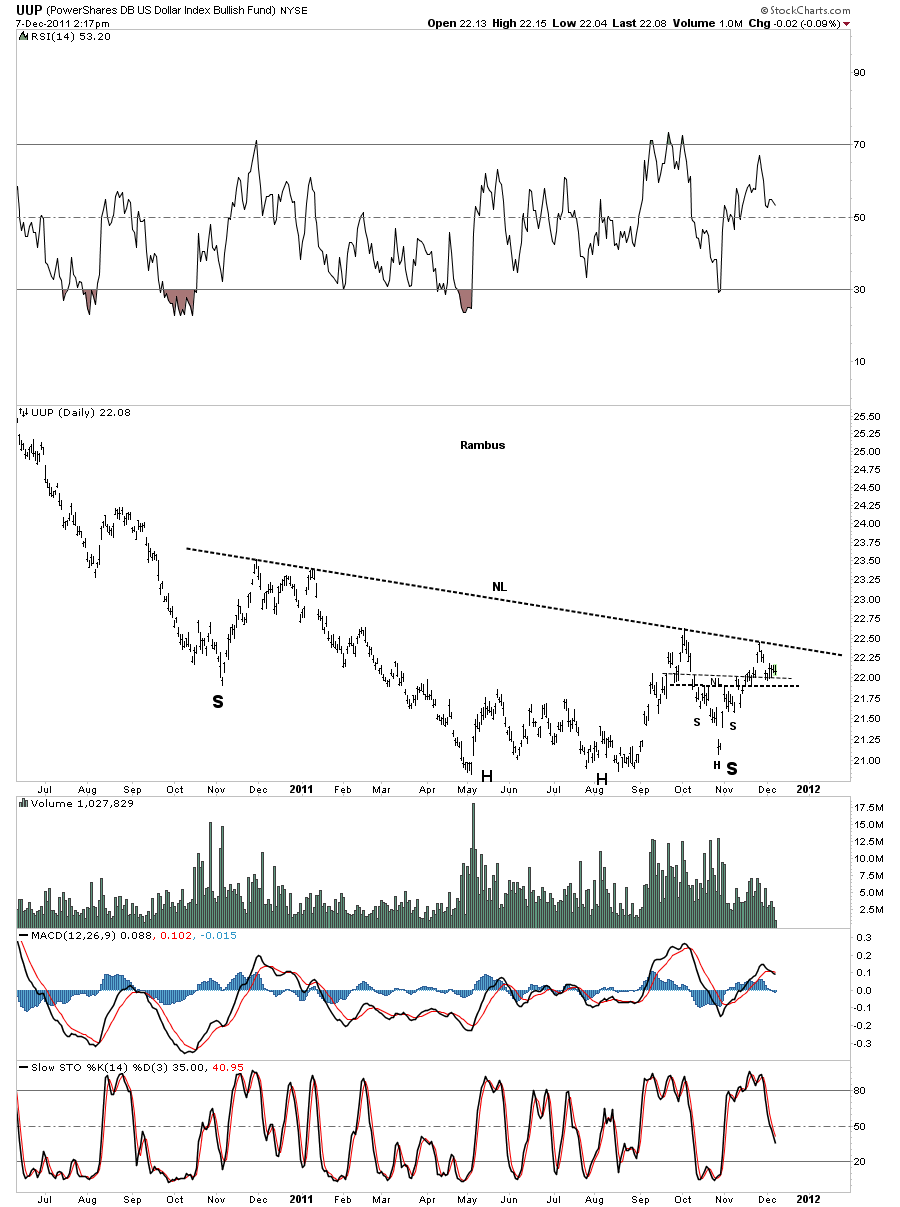
UUP is a US dollar index that tracks the dollar with volume and trades real time unlike the dollar it’s self that you have to wait until the end of the day to see what the price action and volume looks like. You can see the possible, big, one year H&S pattern developing. You can also see the right shoulder has a small H&S bottom. If that small, right H&S bottom plays out, the price objective is well north of the neckline which would be the breakout I’ve been looking for. Until the big 1 year neckline is broken to the upside we are marking time. This is the frustrating part of trading. You see the huge potential for this pattern but until the neckline is broken no confirmation is given. What we don’t want to see is a break below the thick dashed black neckline that has been offering support for the last couple of weeks.
UUP daily possible H&S bottom.
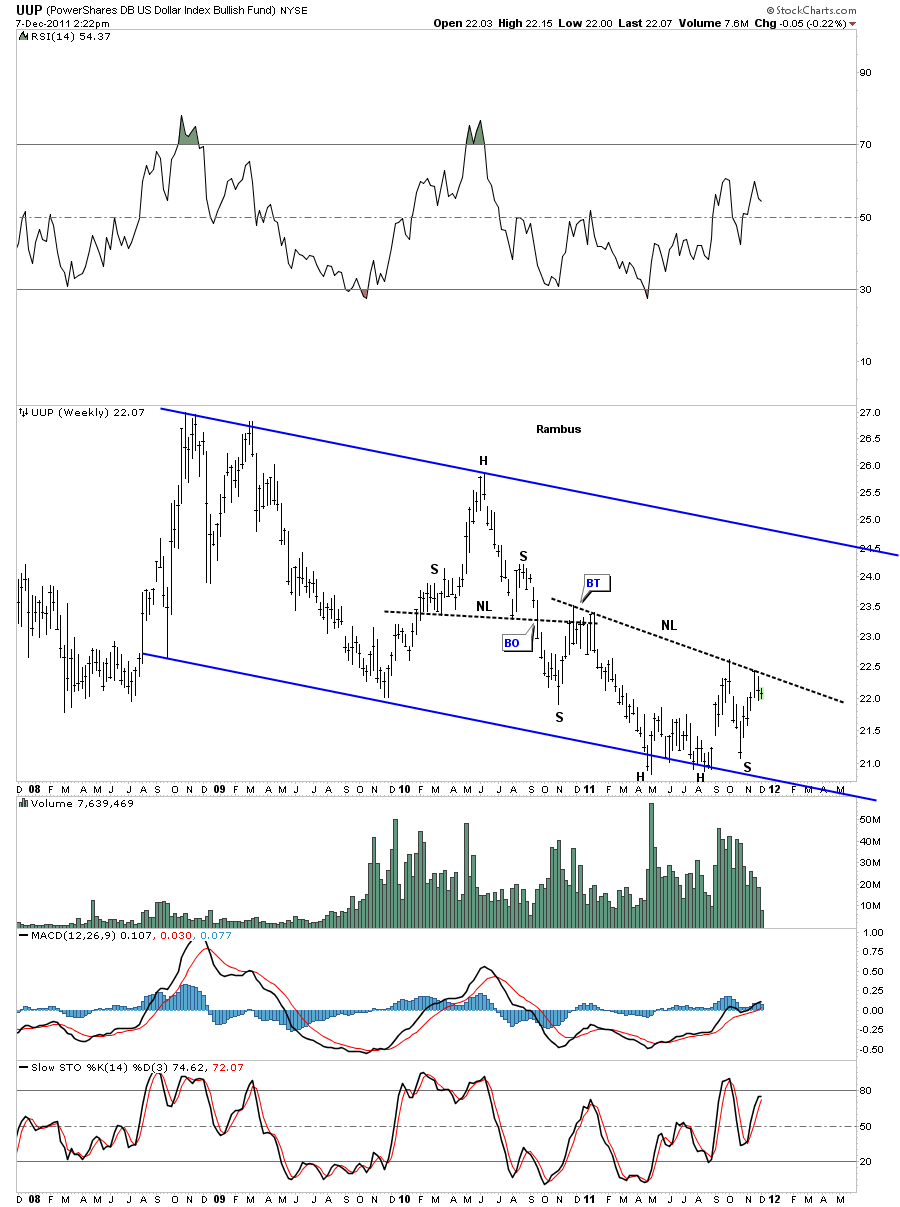
On the weekly look you can see how the UUP is forming our potential H&S bottom right on the bottom rail of the downtrend channel. If there was ever a place to form such a pattern that is the place. Something to keep in mind is that this is a very large pattern that is over one year in the making. Each bar you see is one weeks worth of trading so keep in mind the time factor involved. We will have plenty of time to take advantage of the breakout if and when it occurs.
UUP weekly H&S forming on bottom rail of downtrend channel.


