
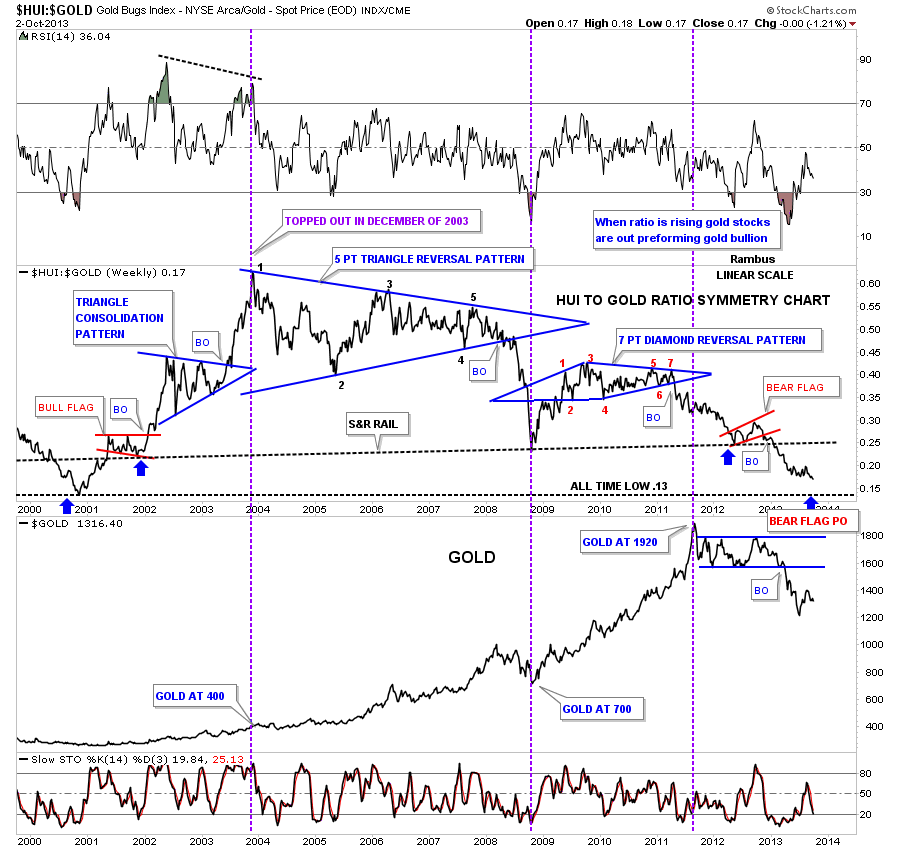
I just want to show you why we are much more leveraged to DUST or short the precious metals stocks vs just being short gold and silver. Below is a combo chart with the HUI to gold ratio on top and gold on the bottom. This is really a pretty incredible chart when you see how badly the precious metals stocks have preformed to gold. The ratio chart also has some pretty nice symmetry going on. I’ve been looking for the .13 area for a long time that will match the start of the bull market low made back in 2001.
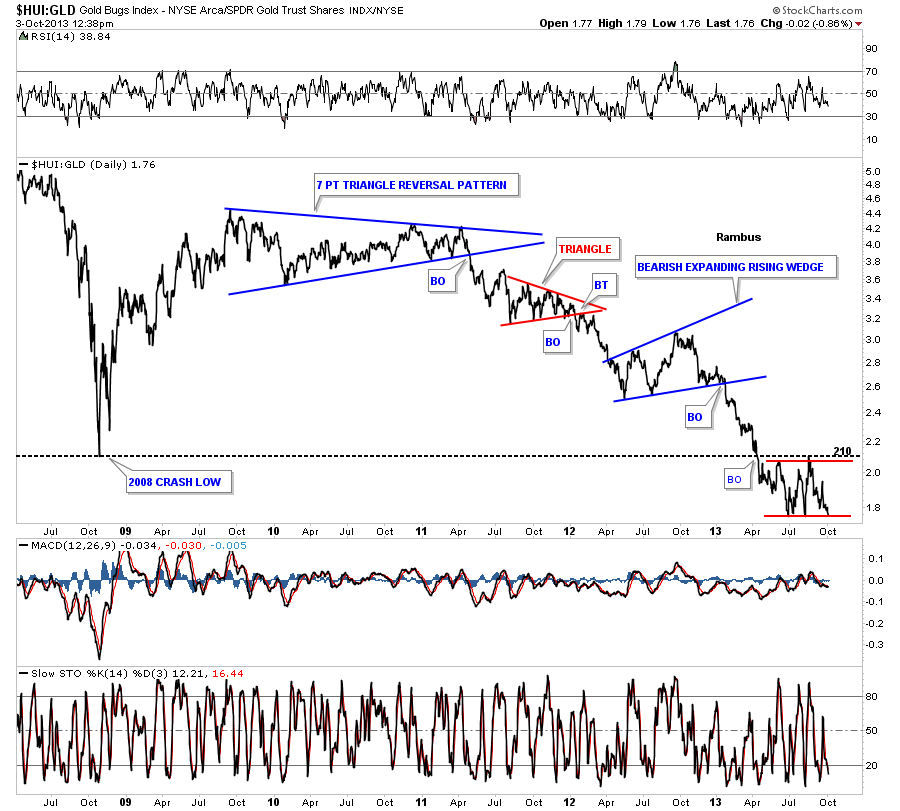
The next chart for the HUI to GLD ratio shows how it has broken below the 2008 crash low and has been consolidating just below that important bottom since July of this year.
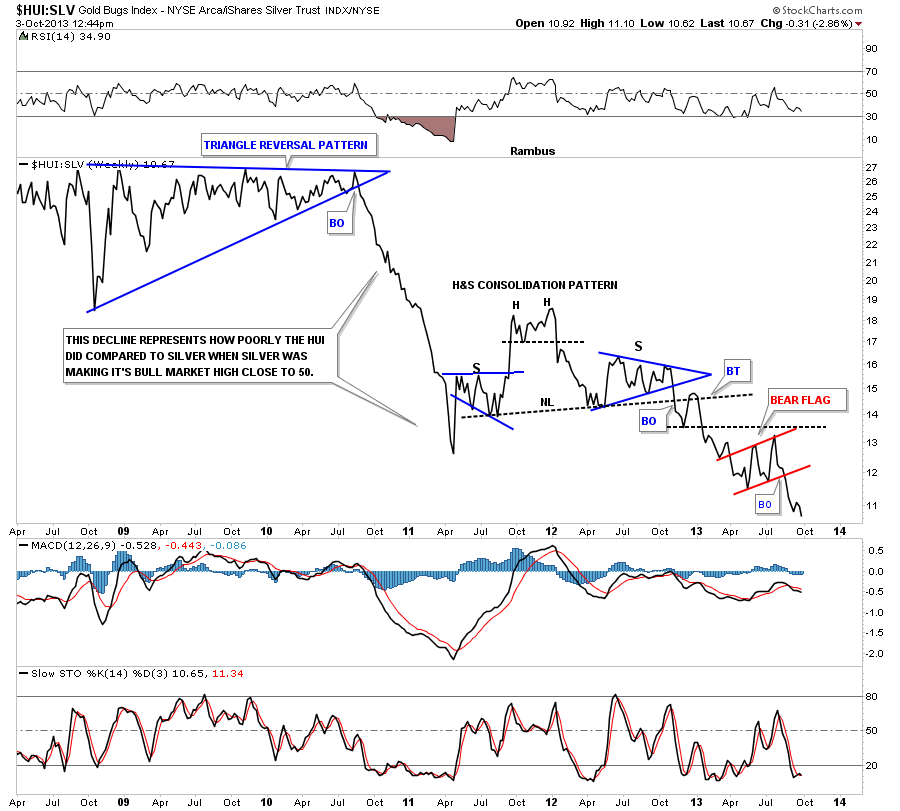
This next chart compares the HUI to silver that shows how badly the precious metals stocks did when silver was making its all time highs back in April of 2011. Notice the almost vertical drop the ratio made into the April 2011 bottom. That shows you how badly the PM stocks did as silver was going parabolic. I remember thinking to myself, something isn’t right with this picture, at the time. Note the big H&S consolidation pattern that formed in the middle of the chart that broke down last fall. In July of this year the ratio broke down again this time breaking below the red bear flag.
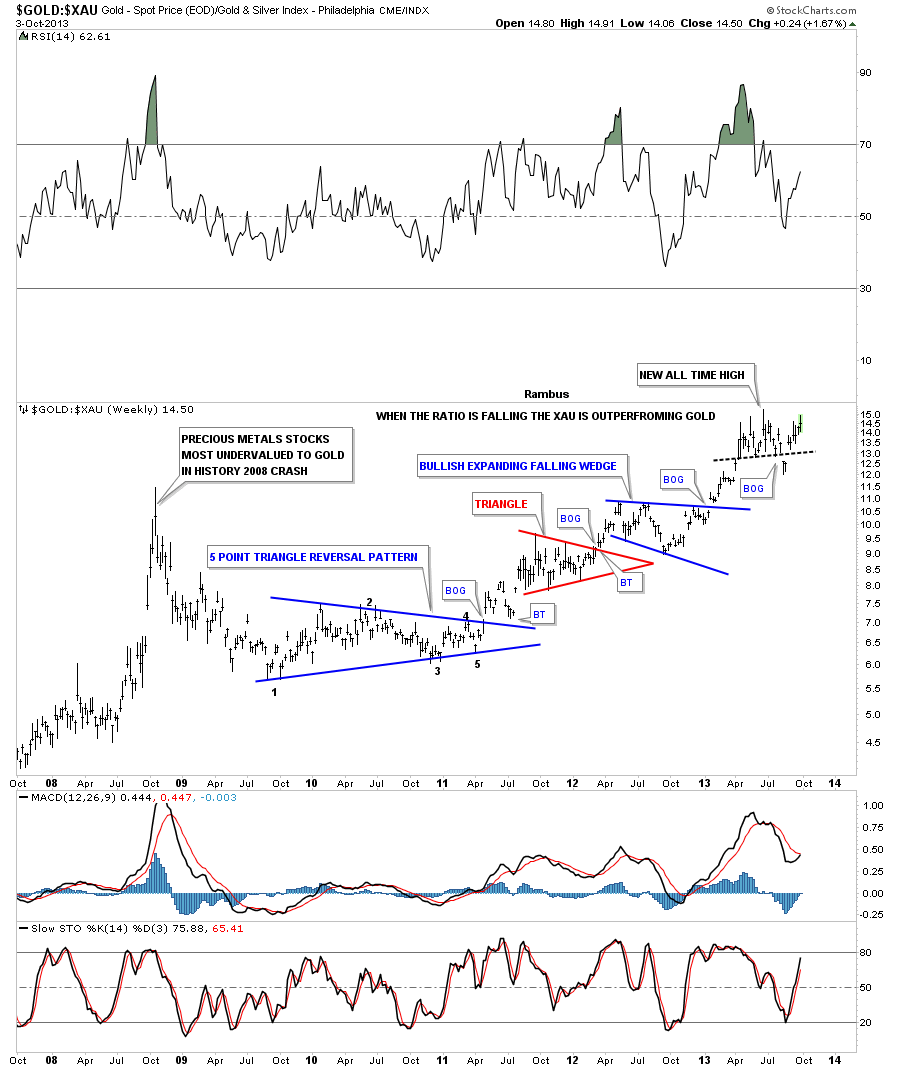
I want to show you one more ratio chart that compares gold to the XAU that tells an incredible story. First note the spike high that was made during the 2008 crash where the ratio went to a new all time high. Everyone said that was a fluke and it was truly an aberration that will never happen again. The ratio fell for the next year or so and then began the long risie back up again. Note the 5 point blue triangle that reversed the downtrend. As you can see two more consolidation patterns formed on the way up that kept suggesting that the precious metals stocks were still underperforming the metal. Then the ratio hit another all time high this summer that looked like it would be the ultimate high for the bear market for the precious metals stocks vs gold. Note the little island reversal that formed just under the black dashed trendline just below the all time high. I thought at the time that the ratio was finally breaking down and it was time for the precious metals stocks to start outperforming gold again. That’s when we took a stab at the precious metals stocks that lasted all of a week or two before we had to exit at breakeven. As I mentioned several times and to Sir Fully this week, ” the only rule in the markets is are there are no rules.” This means stocks can get overbought or oversold beyond anything reasonable and for an extended amount of time. I can guarantee you that if you said, at the beginning of the bull market for the precious metals stocks that they would under perform gold to this extent, they would have put you in a mental institution.
As long as these ratio chart continue to fall we will be more leveraged to the precious metals stocks using DUST as our main tool. It’s possible that when THE BOTTOM finally comes in the precious metals stocks will lead the way higher as they did back in 2001. Right now they are still under performing the metals.