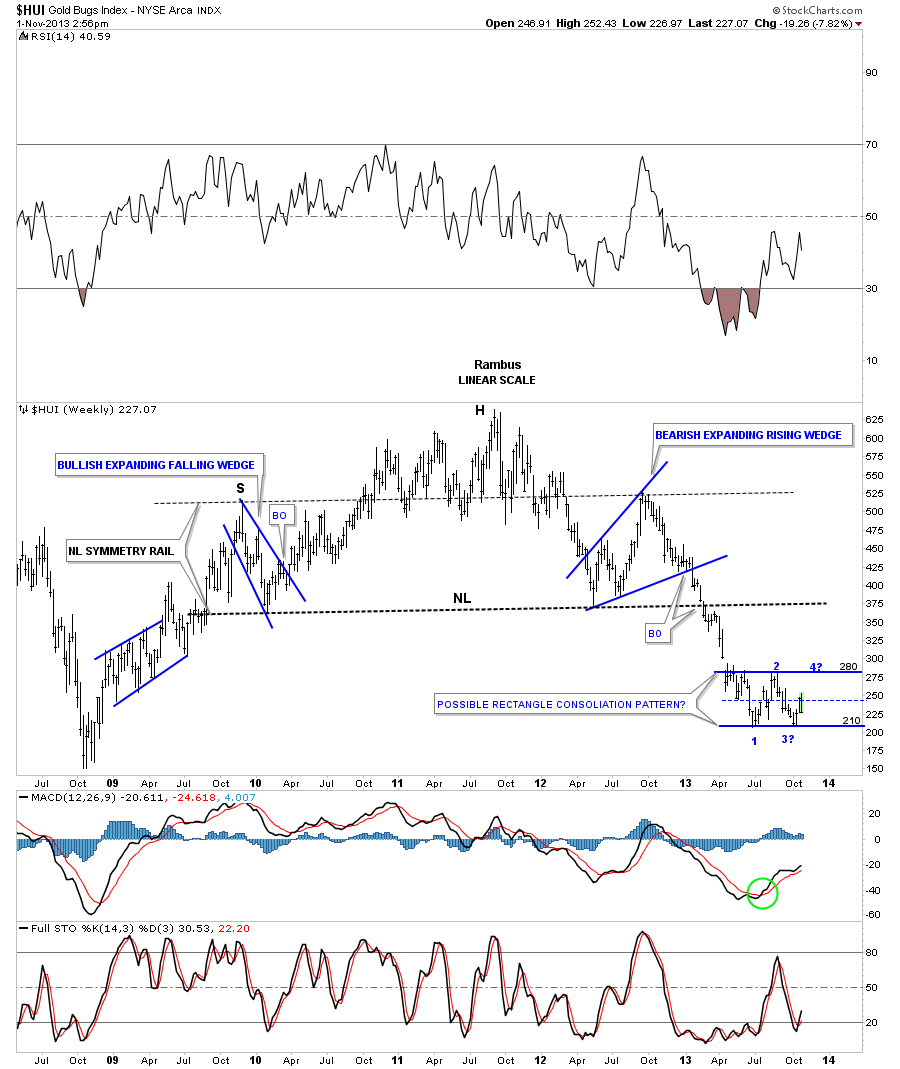
Below is a weekly look at the HUI that shows a possible rectangle forming. As you can see we are getting a bounce off of reversal point #3 that could be the start of the move up to the top of the trading range. The price action could also come back down to test the bottom rail one more time to form a small double bottom at reversal point #3 before it rallies up. Note the thin blue dashed rail that runs through the center of the rectangle. Most rectangles have these halfway lines in them that divide the upper and lower half’s. You can see the low that formed in April starts the center dashed rail. Our current rally has stalled out at the center rail. This is just more confirmation that we are still trading in a congestion zone either be it a consolidation pattern or a bottom pattern. The plan will be to trade the bottom of the rectangle and sell the top until prove otherwise.
Rambus Chartology
Moving forward

