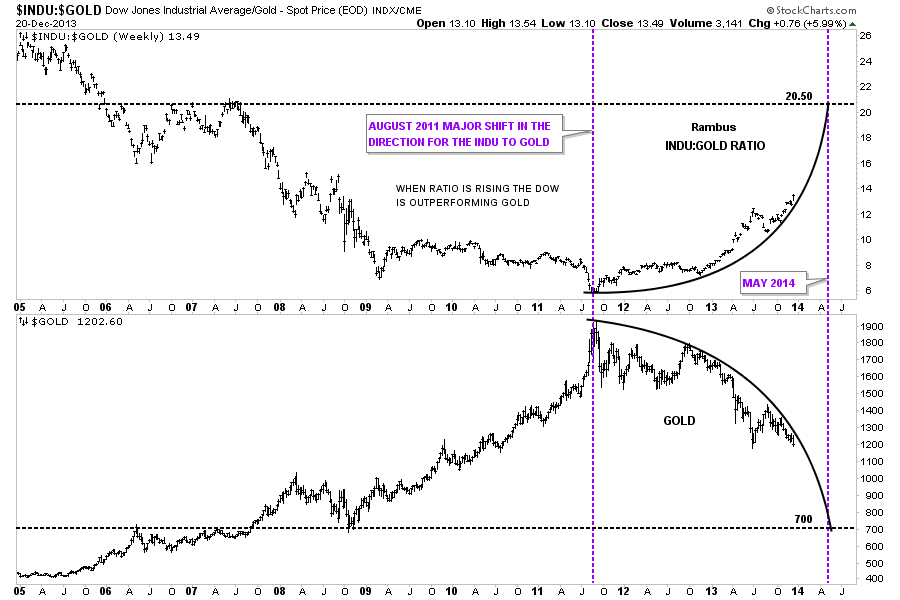
Below is a combo chart that I’ve shown you several times that has the INDU:GOLD ratio on top and gold on the bottom. So far the parabolic move in the ratio and gold is still playing out. As you can see on the gold chart below gold touched the parabolic arc this week with the ratio chart on top doing the same. This was an important week for this ratio and gold to keep the parabolic moves going in each direction.
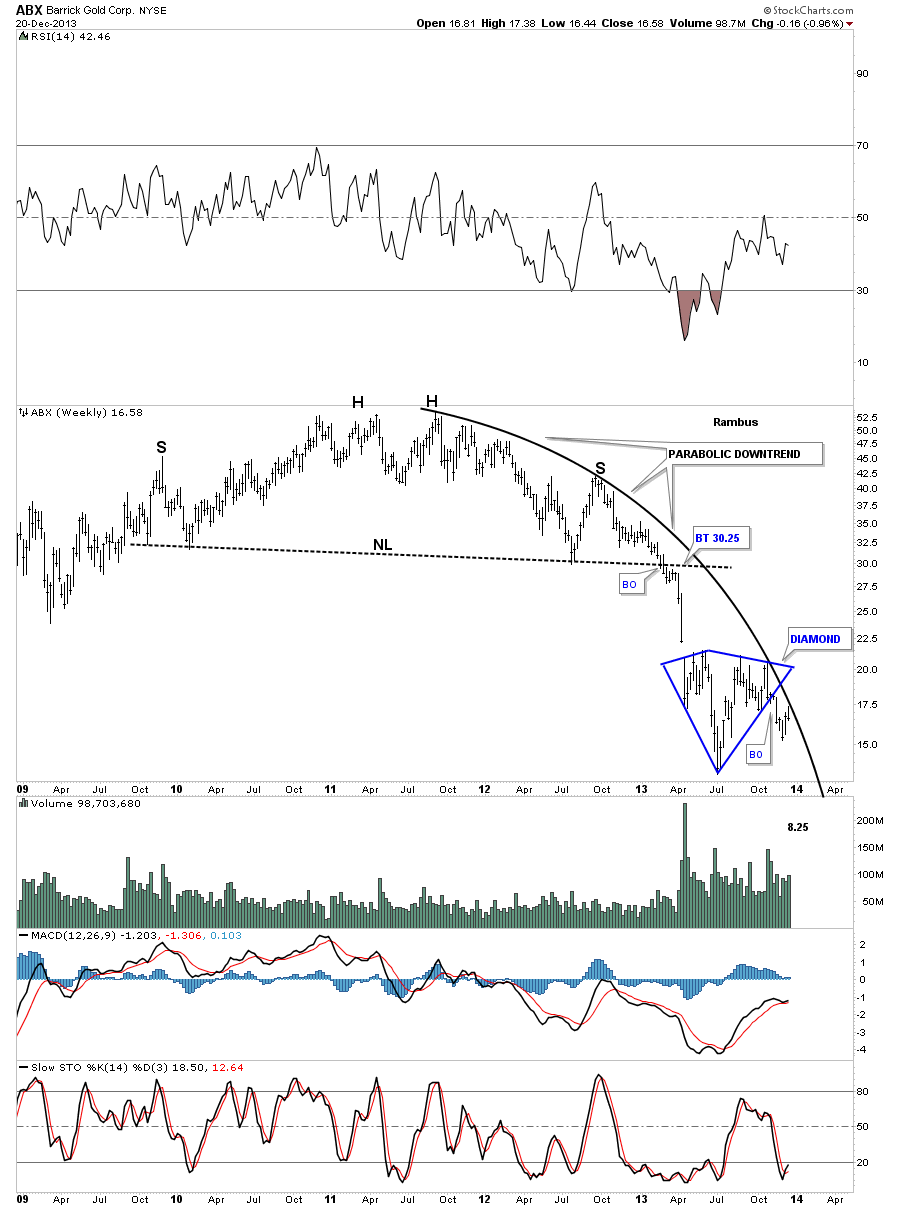
ABX tested its parabolic arc this week and then sold off sharply leaving a nice long tail on the weekly bar.
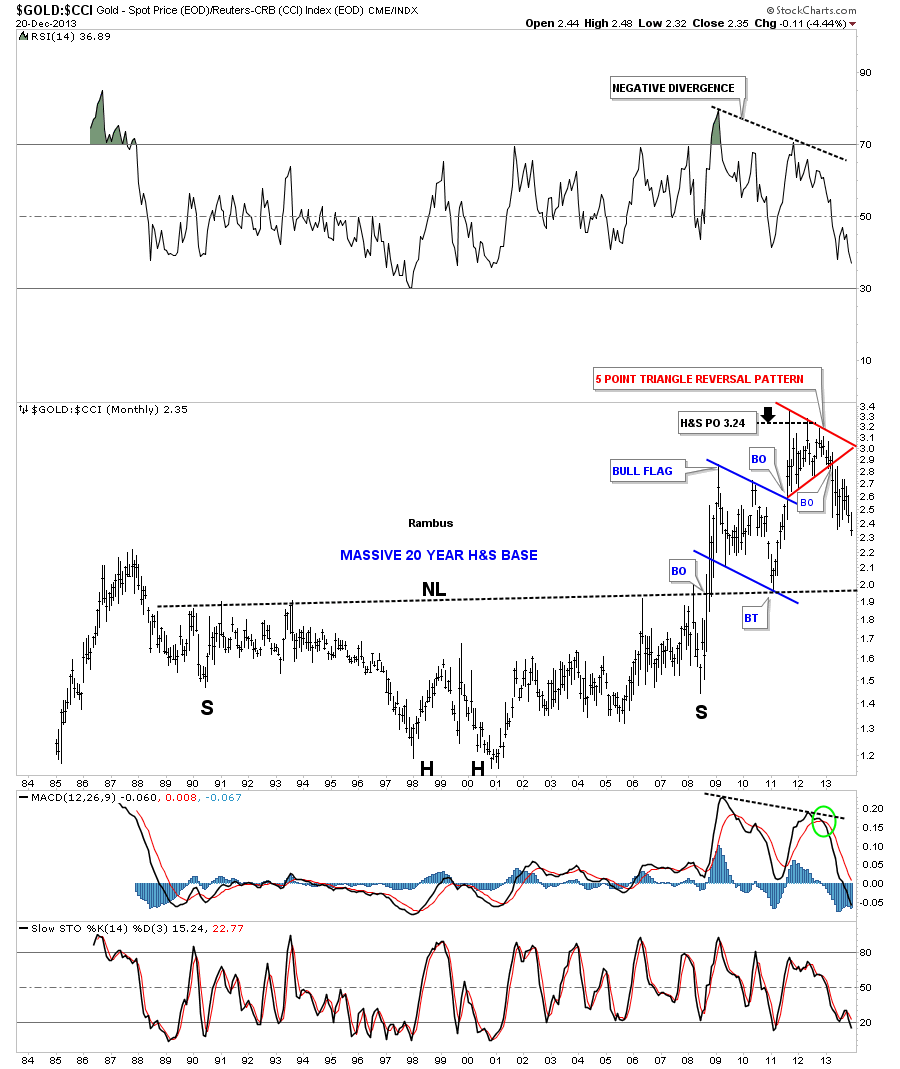
Lets look at a ratio chart the compares gold to the CCI. As you can see on the chart below gold has been under performing a basket of commodities as it’s making a new lower low this month. The massive H&S base measured out almost exactly to the top. Note the red 5 point triangle reversal pattern that called an end to gold out performing commodities in general.
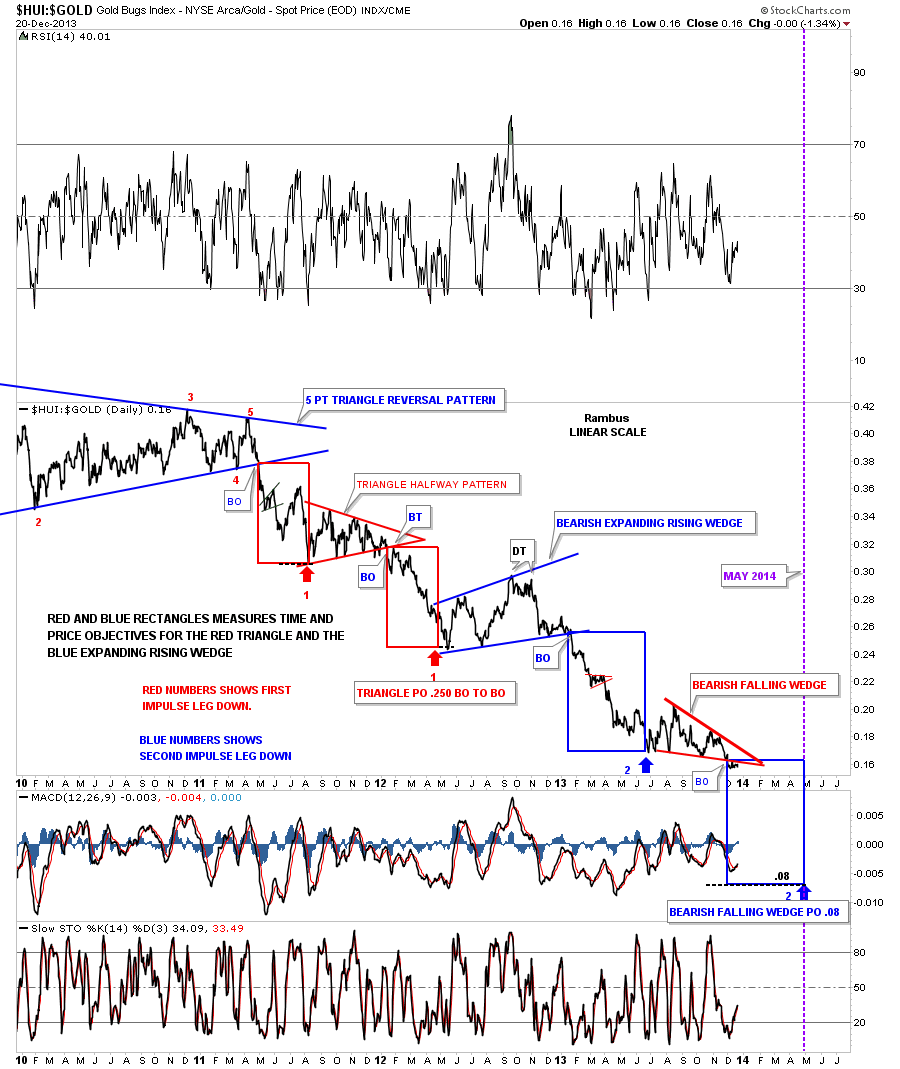
The HUI to gold ratio chart shows the breakout from the red bearish falling wedge still in play as its been in backtest mode since breaking out. May seems to be showing up as a time objective with some of the charts I’m following. For me price is more important than time which goes against some of the trading disciplines out there. So if this ratio hits the price objective first that will take precedence over time.
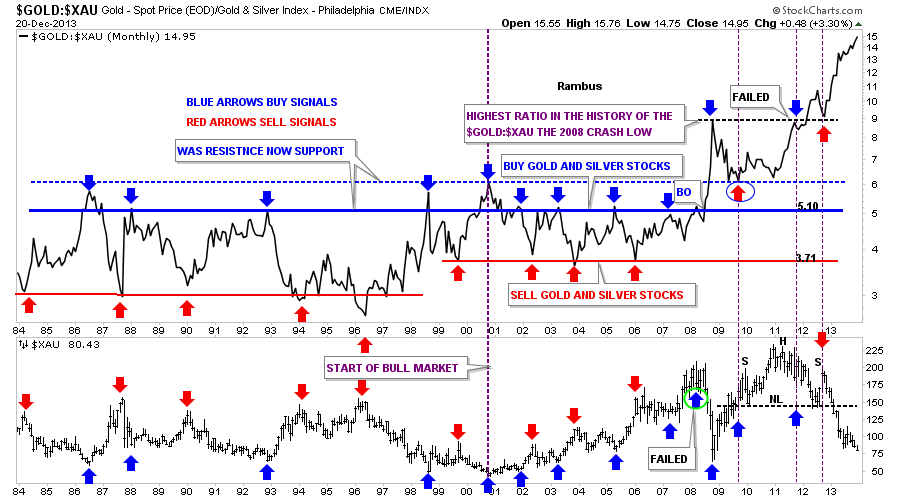
I’ve shown you this gold : XAU chart several times in the past which shows just how bad the big cap precious metals stocks have been under performing gold. This chart goes back 30 years and never has it been this far out of whack. The problem is that it’s still getting worse as there is a good chance this ratio will make a new all time high by the end of December. It is what it is until it isn’t. Time to hit the hay. All the best…Rambus