
In this Weekend Report I would like to show you some charts for silver which shows a bullish and bearish scenario. As we are at an inflection point we need to monitor both sides of the precious metals complex for clues that may give us the next important direction this group, as a whole, may move. To pick an absolute bottom is next to impossible to do but one can get very close sometimes if a clear and open mind is present.
As you know I’ve been very bearish on the whole precious metals complex for over a year now when we took our first short positions back in the first week of December of 2012. We rode the whole bear impulse move down which just so happens to be one of the biggest annual declines in gold and silver in many years. Now, the whole PM complex has arrived at what could be just a stopping point for more downside action to come or could this possibly be an important bottom of some kind that signals the almost three year bear market in silver may have run its course. No one knows with any certainty the answer to this all important question but lets take a look at the silver charts and see if they can give us some clues in which direction the next important move may take place.
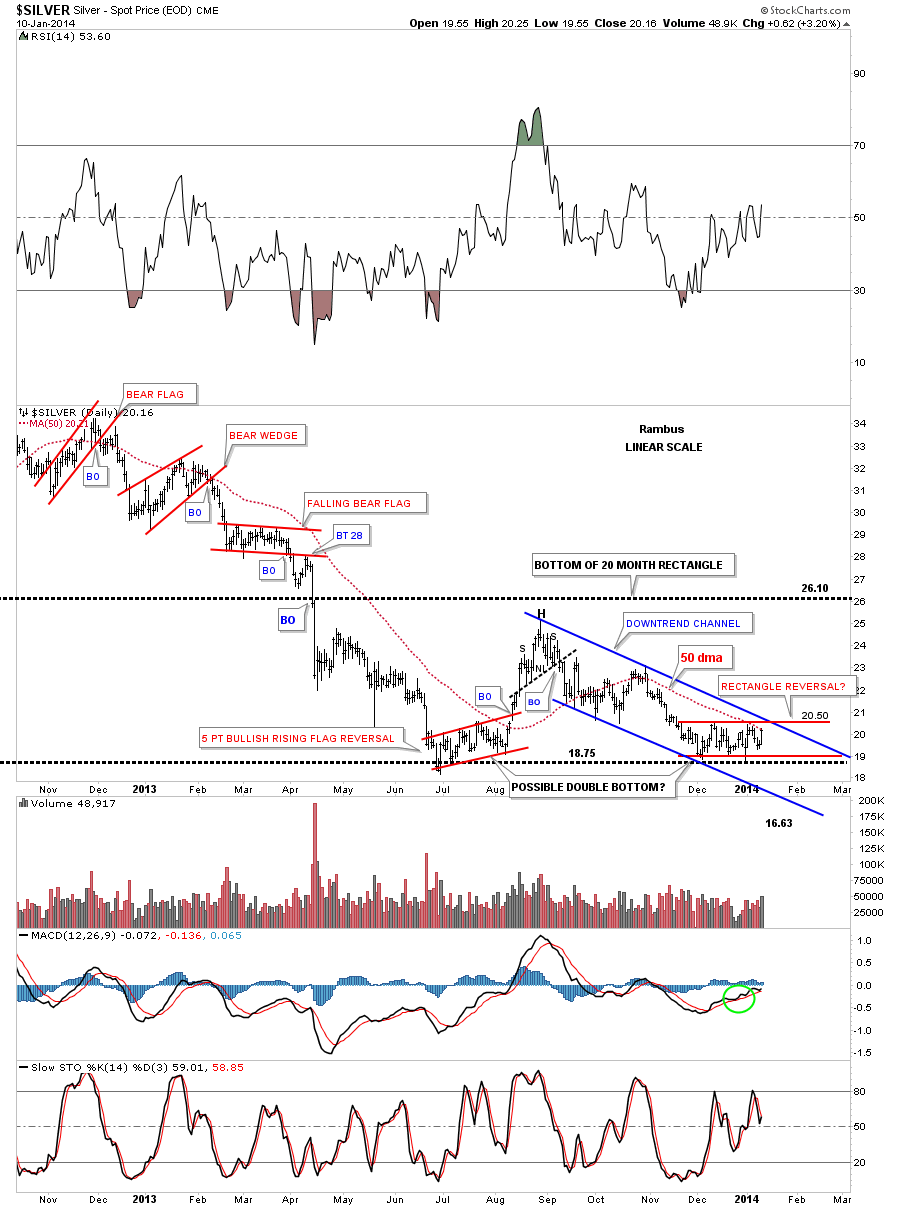
Lets start by looking at a daily chart for silver that we’ve been following for sometime now. As you can see since the beginning of December of 2013 silver has been chopping out a horizontal red trading range at the June 2013 low. This is the inflection point at least on a short to intermediate term perspective and it could also be on the very long term look that I’ll show you later in this Weekend Report. Note the blue downtrend channel and the 50 dma that is running parallel to it. Friday silver tagged the 50 dma. There are three overhead resistance points in which silver needs to overcome before it can move higher. There is the top rail of the red rectangle that will need to have at least 5 reversal points to make it a reversal pattern. Then there is the top blue rail of the downtrend channel and of course the 50 dma. So silver has its work cut out to get on the topside of these now resistance points. Note the June low took on the chart pattern of a red 5 point bullish rising flag before it broke out to the upside. Also the June low and our present low could be a significant double bottom for future reference.
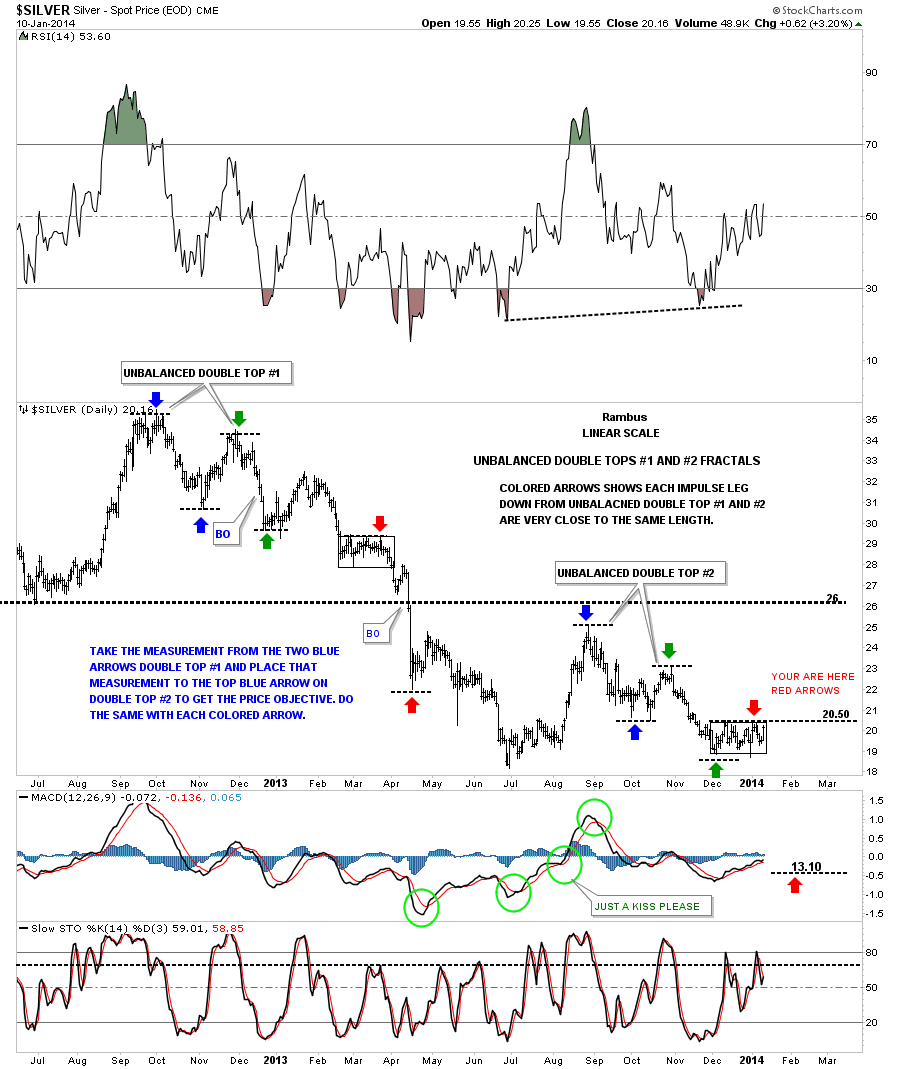
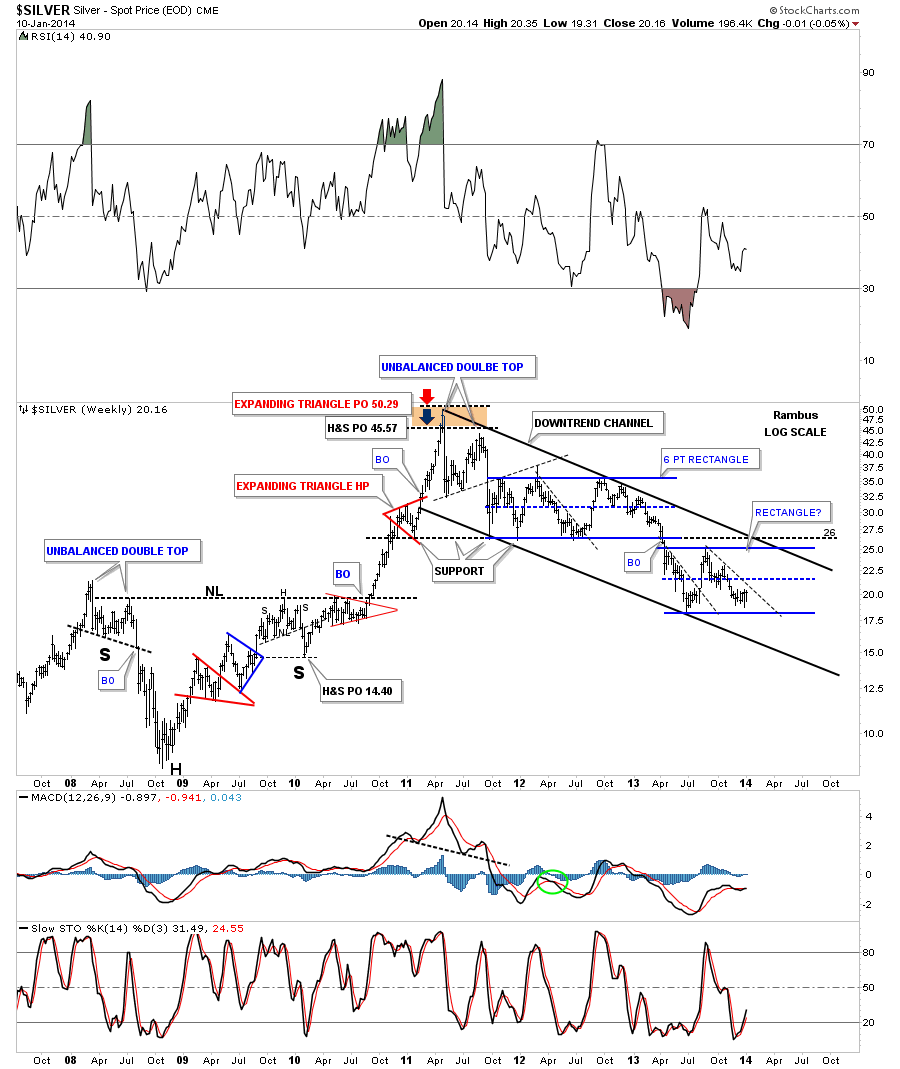
Below is a chart I showed you about 3 weeks or so ago that shows two unbalanced double tops labeled #1 on top and #2 on the bottom of the horizontal black dashed line. Note the little black rectangles just below the down pointing red arrows. Several weeks ago I labeled the lower one as, you are here. I said it still may take several more weeks before it matches the top black rectangle in time before we get a move. As you can see on the lower black rectangle the time factor is just about finished if this rectangle is going to be fractal of the top black rectangle. Up to this point notice how the blue arrows measured from the unbalance double top #1 called the first low in the unbalanced double top #2, blue arrows. Then the green arrows did the exact same thing measuring the second low in the unbalanced double top #2. This is where it gets interesting folks. If you look at the next set of arrows you will see they’re red. If this potential fractal is going to play out then we can expect a hard break down as shown by the red arrows on the unbalanced double top #2 that would take the price action all way down to the 13.10 area. On the other hand if the price action breaks above the black rectangle that would negate this possible fractal that has been near perfect up until Friday.
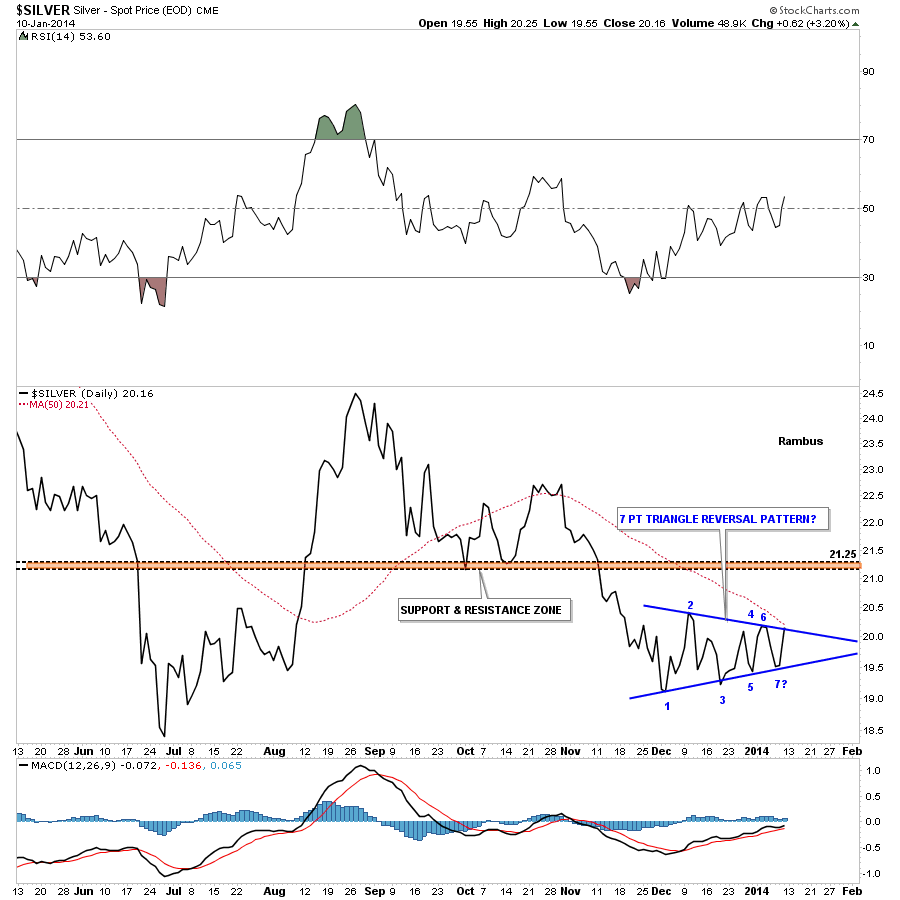
Lets look at a daily line chart for silver that shows us a different chart pattern than what the bar chart is showing us. Remember a line chart just shows the closing daily price that is connected to the next daily closing price. A line chart can takeout a lot of the noise such as spikes that are made during inter day trading. As the line chart shows silver has created a 7 point blue triangle that still hasn’t broken out but Friday’s price action close right on the top rail. It’s going to be an interesting week to say the least.
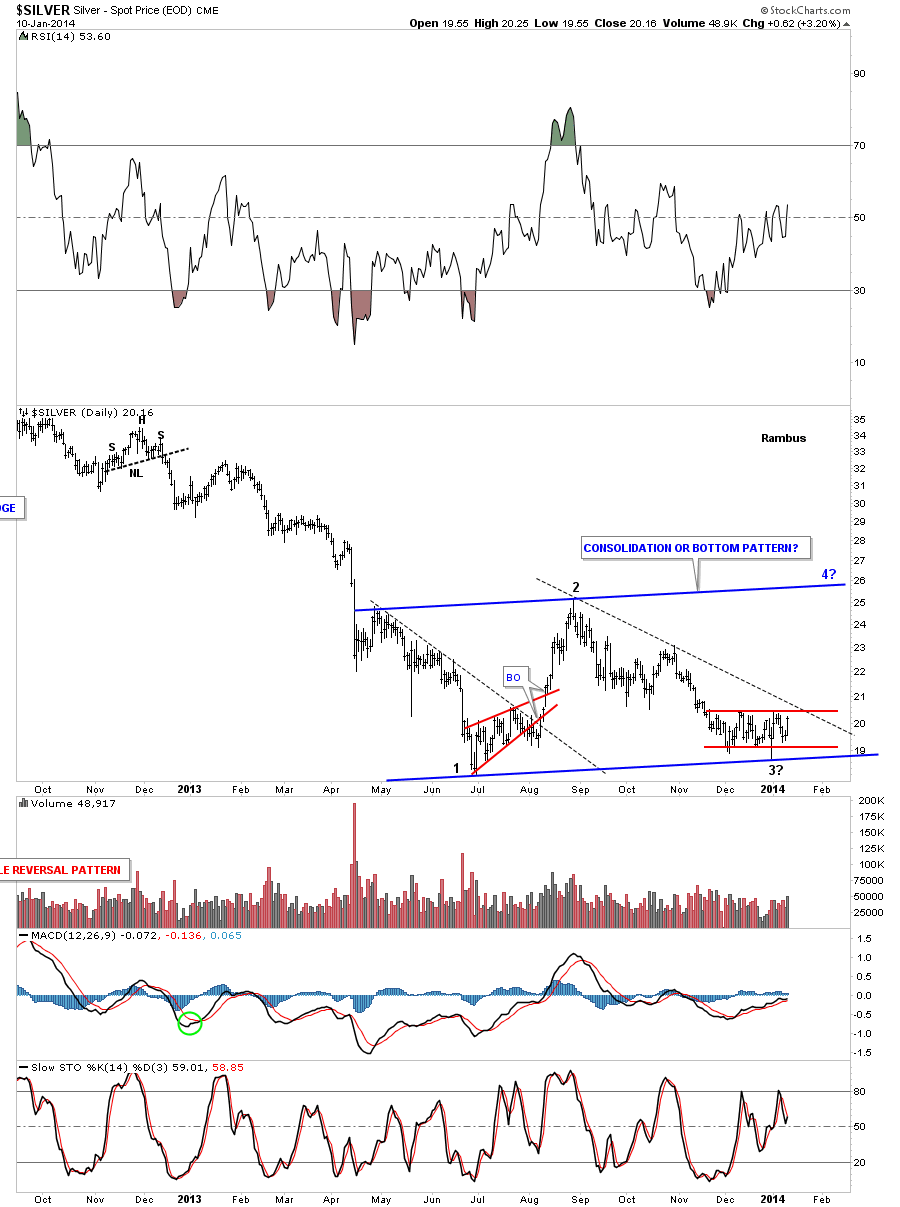
Lets look at one more daily chart for silver that shows our blue 6 month trading range. Notice how our most recent low was slightly higher than the June 2013 low. If we connect the two bottoms we get a slightly upsloping pattern. In my mind this 6 month trading range has to be one of three patterns at this point. As it only has completed two reversal points so far this tells me the consolidation pattern isn’t compete yet and we need one more rally up to the top blue rail to put in the 4th reversal point to make this trading range a possible consolidation pattern to the downside. The second possibility is this trading area is creating a H&S consolidation pattern with the smaller red patterns the left and right shoulders and the bottom blue rail would be the neckline. The third possibility would be this is a true double bottom which is a reversal pattern. As you know I always look for some type of reversal pattern such as a H&S, a double top or bottom or a 5 point pattern of some kind such as a rectangle, triangle or falling wedge to reverse the trend. This would be a place to see a possible double bottom.
Now I want to show you a weekly chart for silver that puts a couple of things into perspective. First, why did the decline stop in June of 2013 at the 18 area. On this log scale chart you can see the blue 6 point rectangle was a halfway pattern as measured by the blue arrows. Another intriguing thing about his weekly chart is the neckline extension rail taken off the 2008 inverse H&S bottom that led to the parabolic move to fifty. This is basically the same neckline extension rail that I’ve shown you on the gold chart. So we have two very good reasons why silver stopped where it did in June and December of 2013. As you can see the neckline extension rail has reversed its role from resistance, back in 2008, to now support. All this chart tells is that there is a good reason why silver has found support where it has. That doesn’t rule out the fact that this is still a consolidation pattern in the making and move lower will resume once a 4th reversal point is completed. Note the little red bullish rising flag that showed me where to look for the top in silver back in April of 2011. Is our blue rectangle showing us the bottom for this bear market as it to is a halfway pattern?
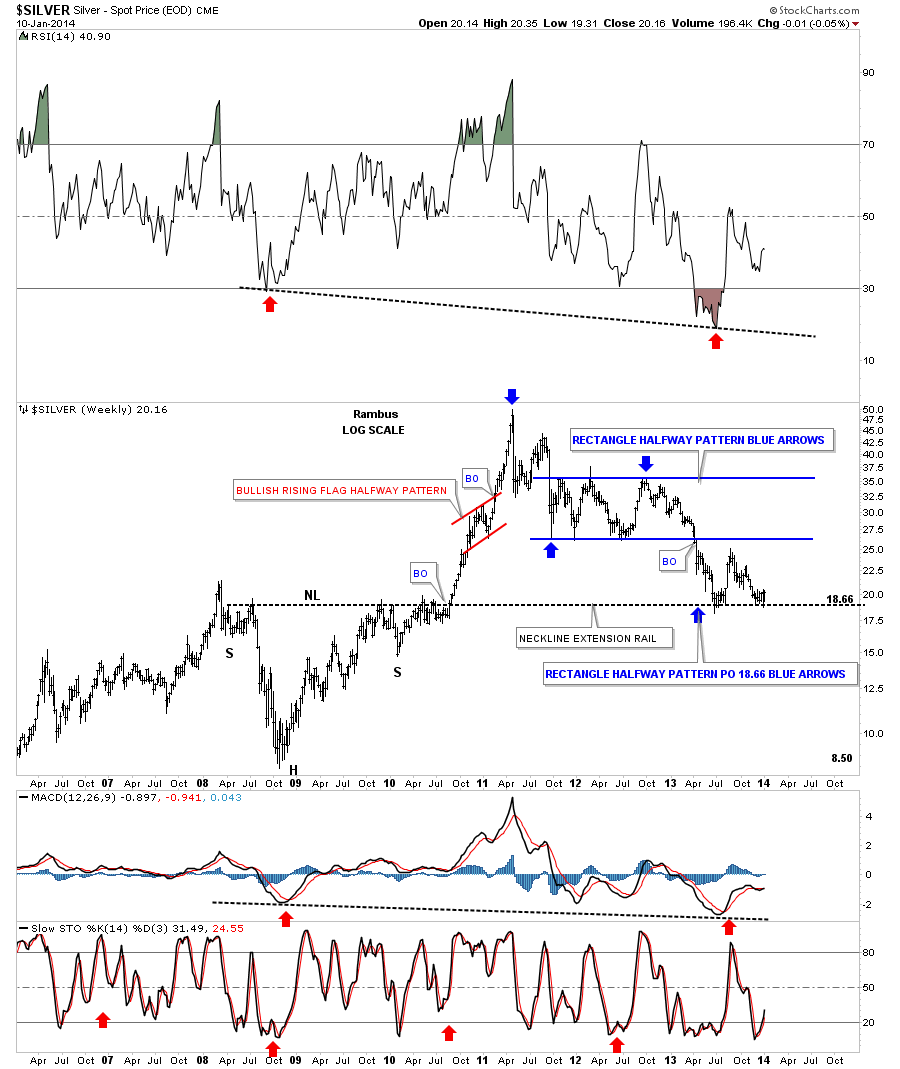
Lets look at another weekly chart that puts our bear market into perspective. So far the downtrend off of the April 2011 high has formed a perfect parallel downtrend channel. Just like any other chart pattern I like to see at least four reversal points in an uptrend or downtrend to know that it is valid. As you can see our recent low in June of 2013 is showing us a possible 4th reversal point within the downtrend channel. That’s not to say we can’t have a fifth or sixth reversal point form down the road but we are looking at the current price action for clues. One step at a time.
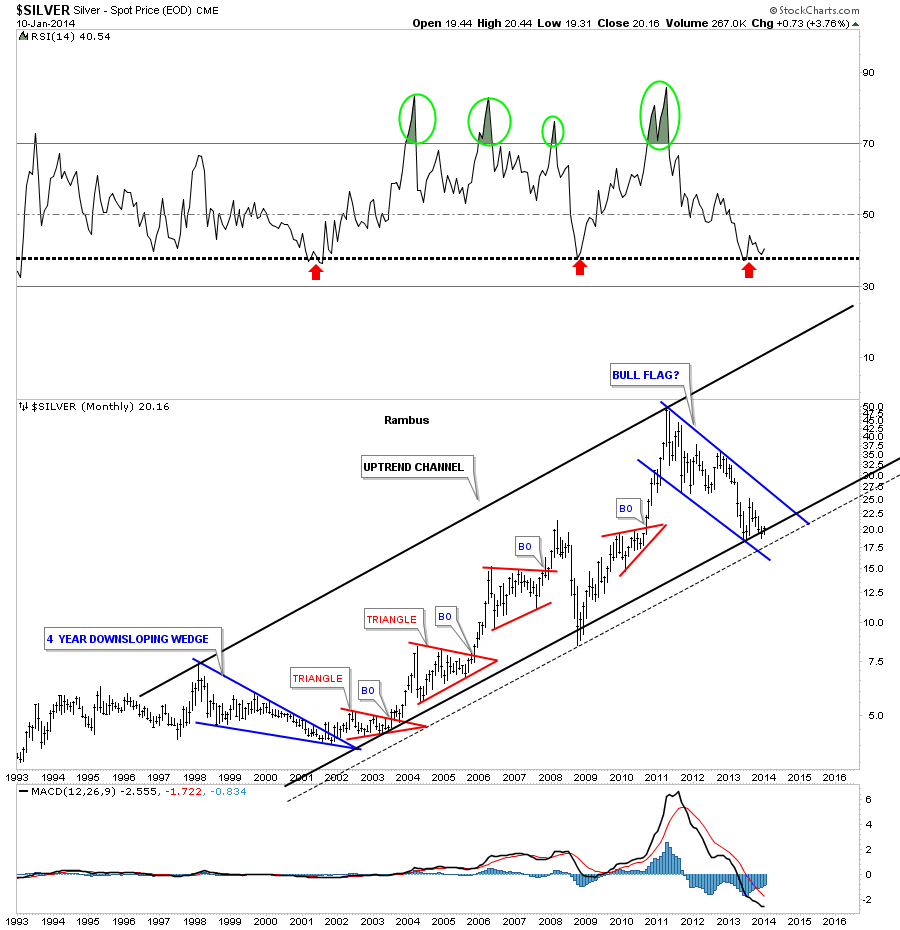
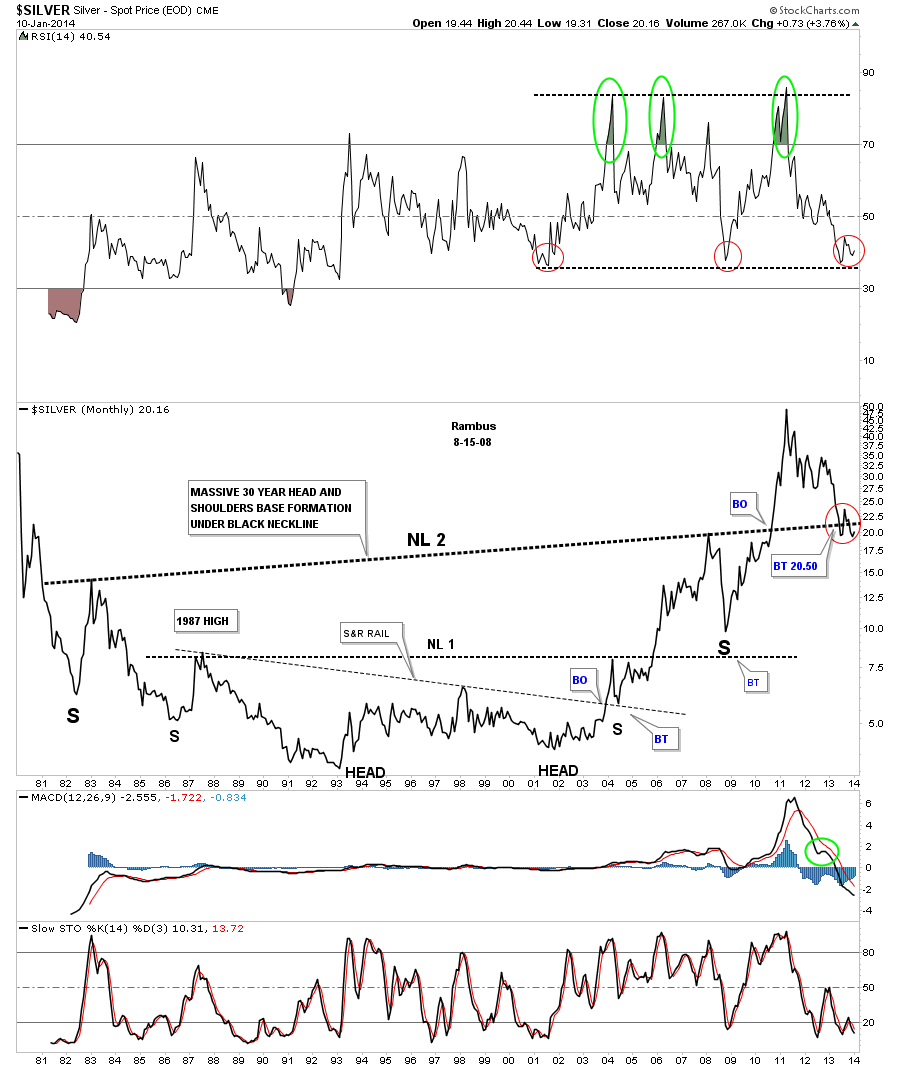
The very long term look at silver shows a possible parallel uptrend channel forming with just a slight break of the bottom rail which is shown by the dashed lower rail. The RSI at the top of the chart shows us this is the area where the previous two important lows came into play. I’ve labeled our blue downtrend channel as a possible bull flag which is the exact same width as the blue 4 year down sloping wedge that actually started the bull market once the price action broke above the top rail back in 2001.
I want to end this Weekend Report with two more charts. One is very bearish and the other could be very bullish. Lets start with the possible bearish scenario which shows the potential H&s top that I’ve shown you before. So far the price action is bouncing off the potential neckline that I said should be expected on the initial hit. Silver could rally up further building out a right shoulder.
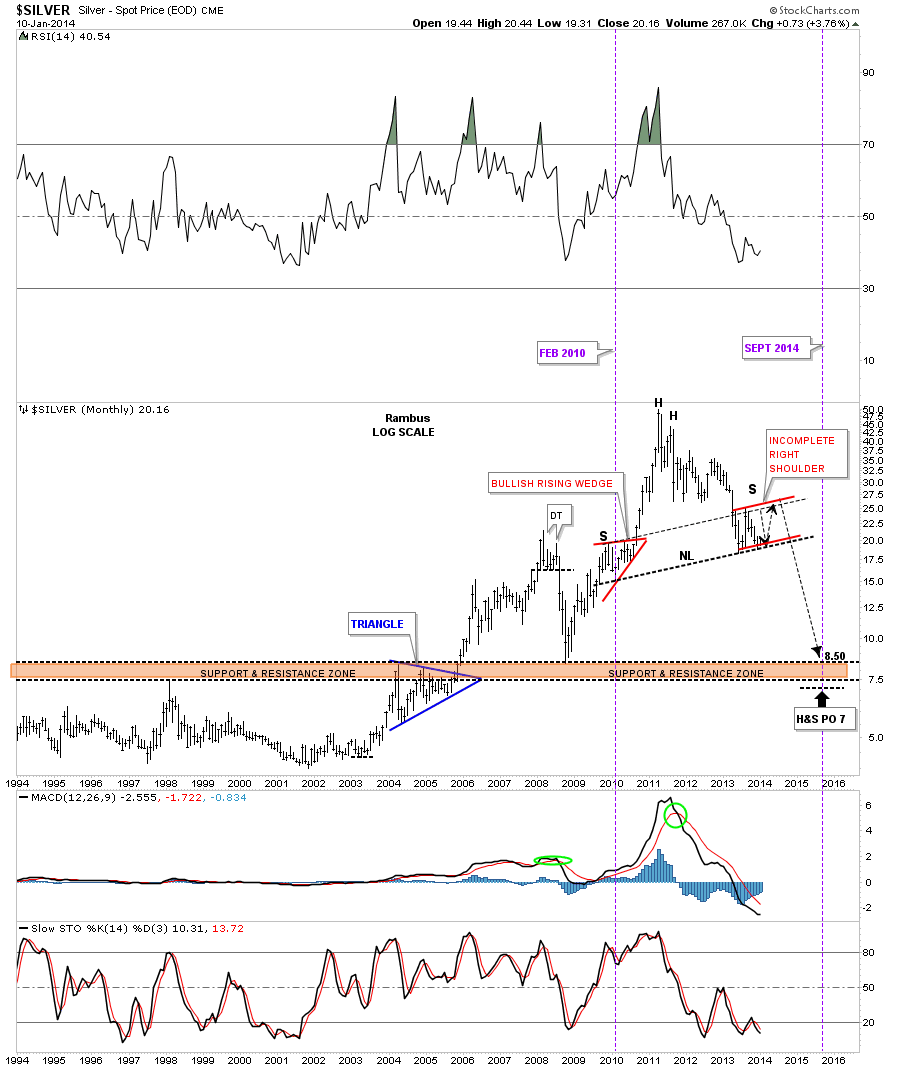
This last, very long term monthly line chart for silver, I’ve written off several times thinking the pattern was failing but each time I write it off it comes back into play. I built this chart many years ago and it has worked out beautiful. So far the only thing wrong is this potential backtest to neckline #2 has been a little strong. You can see how critically important this backtest is to neckline #2 as the price action below that neckline shows a massive 25 year base and we are in the backtest phase of the huge H&S base. As you can see I was looking for the backtest to come in around the 20.50 area. We have traded about 2 points lower than that but this being such a huge pattern, maybe two points won’t mean that much. We’ll just have to see how it plays out. This chart also shows you why the potential double bottom is forming at a critical juncture if this backtest is to be successful.
So here we are looking at a possible very large and important inflection point that may signal the next major move in silver. All we can do is follow the price action and see what it tells us. The very first thing we need to see is silver takeout the 50 dma and the overhead resistance to get the ball rolling in the up direction. It is close but not quite there yet. We just need to keep an open mind for either scenario and trade accordingly. All the best…Rambus
Free Trial
http://rambus1.com/?page_id=10