
Before we get into tonight’s charts I would like to explain what my goal is right now for the precious metals complex. We never know 100% for sure when we have a bottom in place. All we can do is look at the charts and indicators and try to get the odds in our favor on when to make a move. For the short to intermediate term I think we have a decent bottom in place in which we can try to take advantage of a move higher.
The hardest part of getting on board for an intermediate move is in the very beginning stages. First you have to identify a bottom, in the case of the precious metals complex, and then you have to start buying. Think of these impulse moves as two steps forward and one step back. We have just had our two steps forward and today marks the point of a possible one step back. This is normal market behavior. Giving back some of your hard earned gains makes you feel uncomfortable and you get this feeling, in the pit of your stomach, that you must sell. If we are truly in an impulse move higher your mentality should be to buy weakness. When your in a trading range is the time to sell into strength not in an impulse move. These are two completely different techniques. Right now I think we have entered at least an intermediate term move in the precious metals stocks and that is how I’m going to play this move until something tells me different.
My experience has taught me to trade the intermediate term move and hang on for dear life when things start moving both going up and coming down. This is where the big money will be made IMHO. Those that try to trade in and out will get a few good trades off but will eventually get out of sync with the move and find themselves on the sideline when the heart of the move takes place. I know for a fact that this is already happening with some of our subscribers that decided to sit out the move in some of the 3 X long eft’s we’ve been buying for the intermediate term move.
This is the point where one has to decide on which type of trader they want to be. If you want to be a short term trader then you really need to be disciplined and follow your system to the letter. If you chose to be an intermediate term investor then you need to get positioned for the longer haul by buying your favorite precious metals stocks now. You need to have the mindset that there are going to be corrections along the way but you have the confidence in the trend to hang on. It takes a lot of discipline and courage to ride out these inevitable corrections but that is the only way I know to make the big bucks. With that said lets look at some charts and see what they maybe telling us.
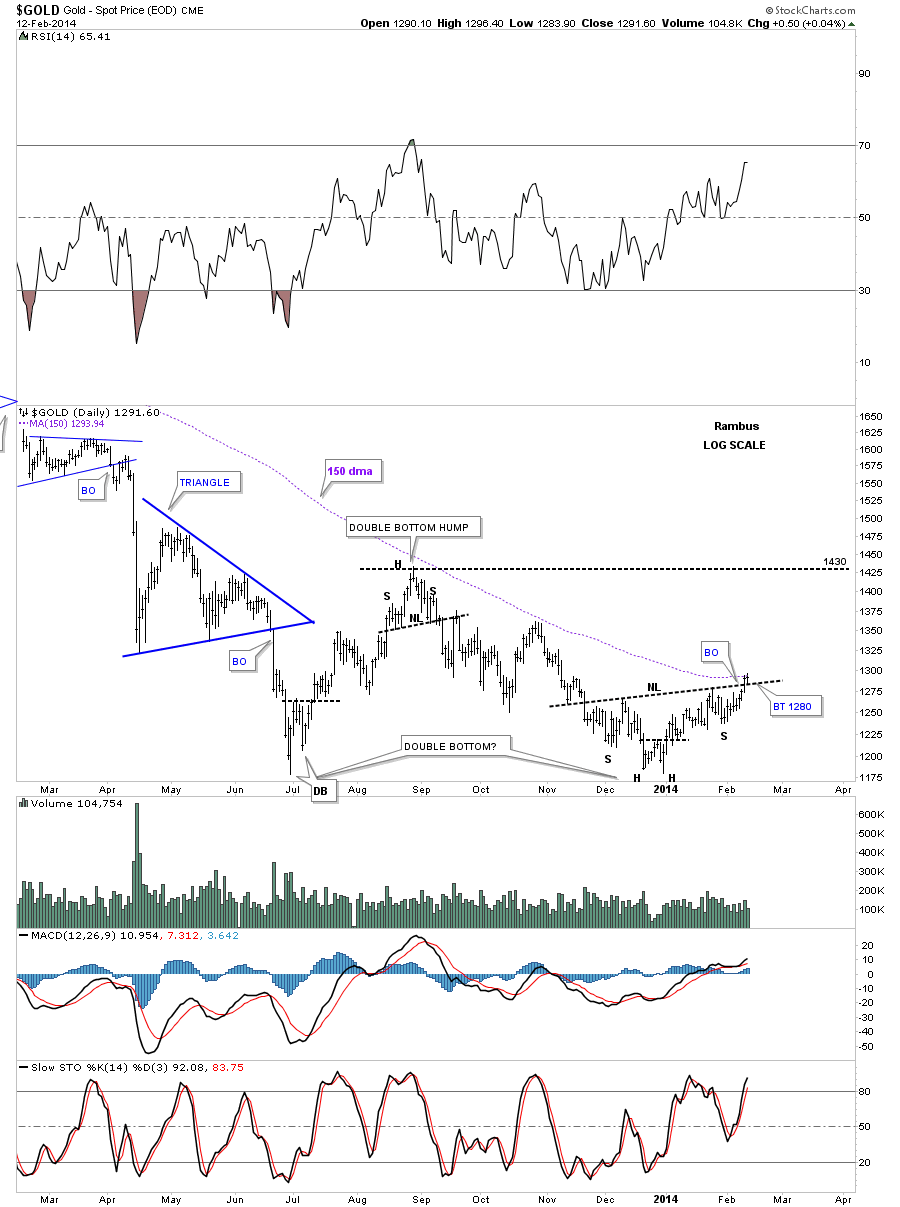
Lets start by looking at a daily chart for gold that is showing us a potential inverse H&S bottom that is the second bottom of a possible much bigger double bottom that goes back to the June low. This is exactly where one wants to see one of these reversal patterns form. If you recall gold made that very small double bottom, in December, that is now the head portion of the bigger inverse H&S bottom. Note the little unbalanced double bottom that was made back in June of last year that started the bottoming process and the small H&S top that was made at the 1430 top which I’m labeling, for the time being, as the double bottom hump. You can see how important the 1430 area is going to be for our intermediate term move. Note the last two bars on the far right hand side of the chart that shows the price action for gold doing a ping pong move between the 150 dma and the neckline. This is a big deal folks. Its showing us two very hot lines right now, one that is resistance and the other support. As I’ve shown you many times in the past when a stock is trading up against an important trendline, that is acting as resistance, you often see a smaller pattern form just below that important line of resistance. A moving average is no different than a trendline as they both can act as support or resistance. What makes me think that gold will break above the 150 moving average is the inverse H&S bottom that is forming just below it. If gold does in fact break above the 150 dma that will be a very big clue that gold has some legs to run higher.
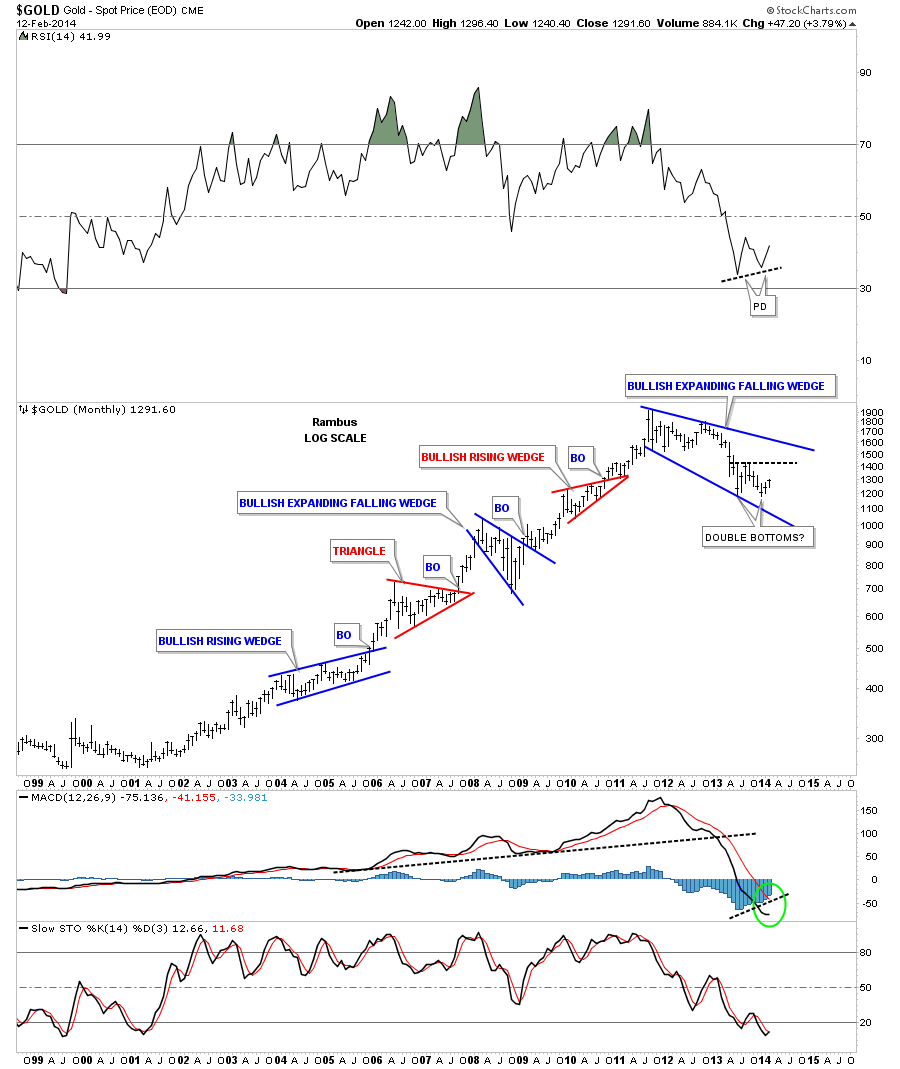
Lets look at the long term monthly chart for gold that shows our possible double bottom that is forming at the bottom of the big blue expanding falling wedge. The first bottom was made in June and the second was made in December. If you ever looked at a chart and said to yourself, ” man I wish I would have bought at that bottom.” Well folks this is how you do it. You never know 100% for sure if the bottom is in place until you can look back in hindsight. A year from now will we look back at this chart and say, yep that was the bottom. Only time will tell. It takes guts, some luck and a whole lot of discipline to buy into any important bottom because the news is always the worst. Risk is always part of the equation also.
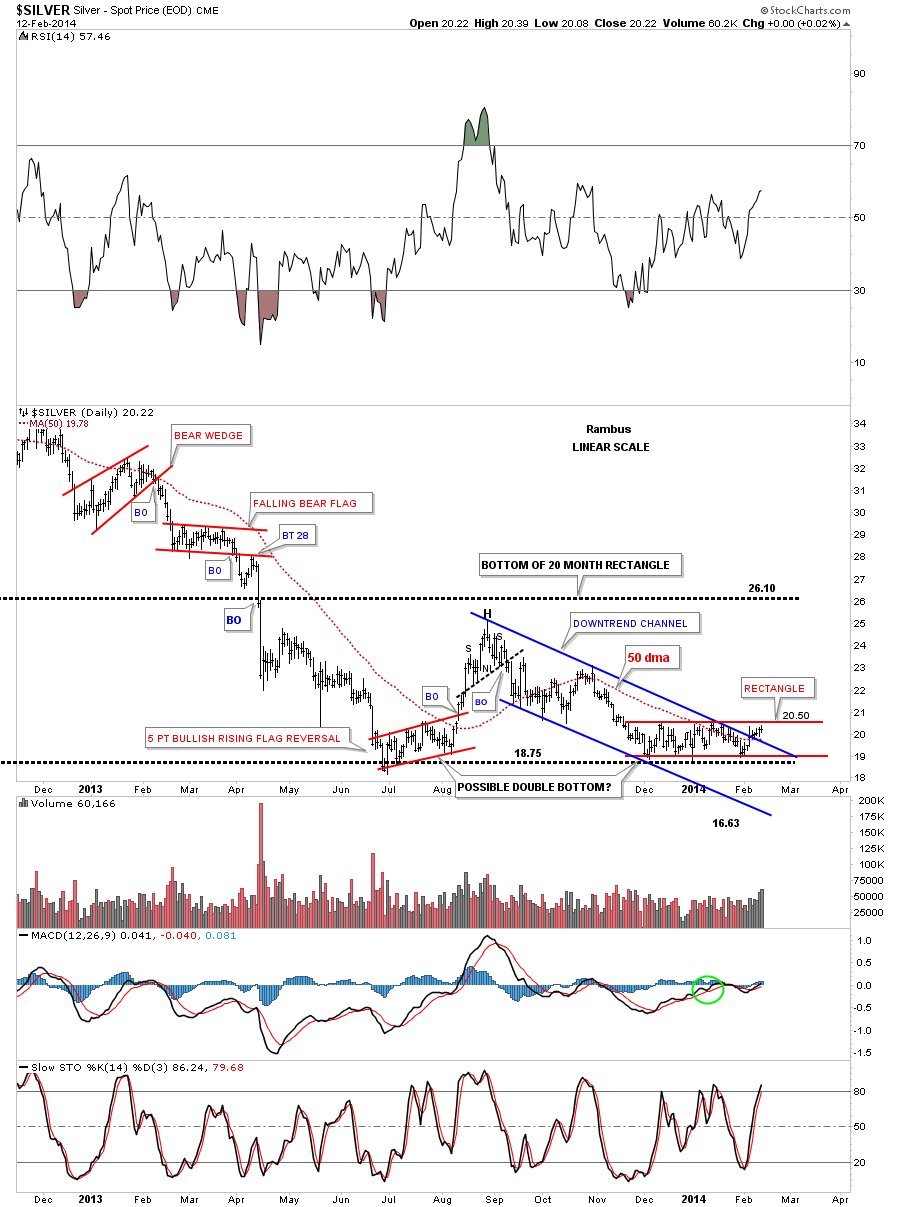
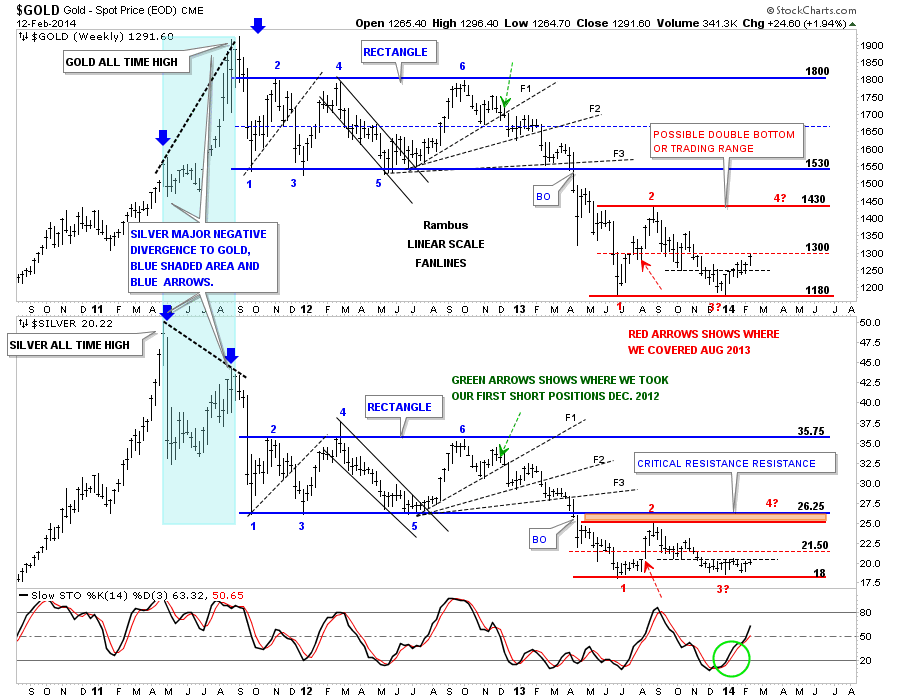
Lets now take a look at silver that is slowly grinding its way ever so slowly higher. As you can see it has broken above the top rail of the blue downtrend channel with a clean backtest. It’s again testing the top rail of the red 2 and 1/2 month old rectangle. It’s also trading above the 50 dma. Is it to forming a double bottom just like gold? We’ll know in hindsight.
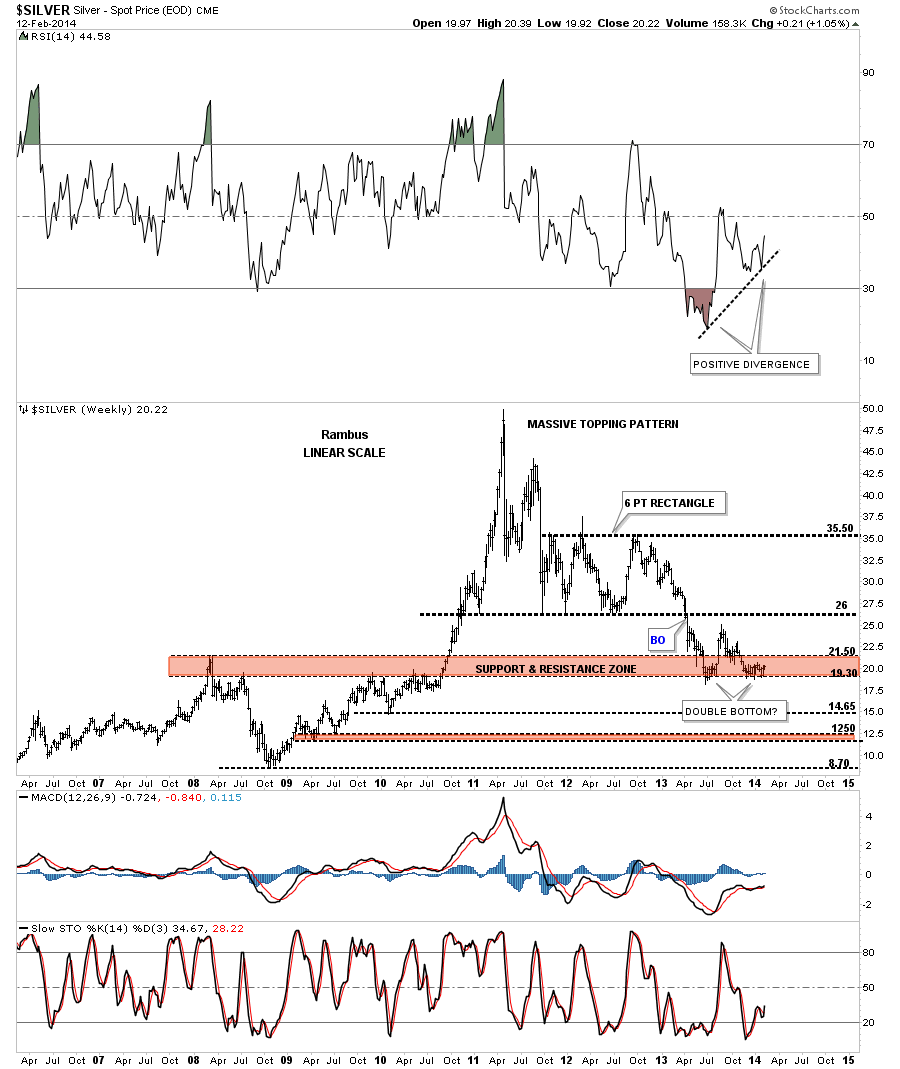
Lets look at a long term weekly look at silver that shows it finding support at the brown shaded support and resistance zone. As you can see it has held support twice so far which is possibly forming a double bottom. Until silver and gold for that matter, can trade back above the bottom rails of their 22 month old rectangles, the downtrend will remain in tact. For the intermediate term move, I’m looking for the old high that was made back in August of last year, to be our first price objective. At that point we’ll have to reassess the situation and take it from there.
Below is the gold and silver combo chart I’ve shown you several times in the past that shows the trading action since they both topped out in 2011. I want to focus your attention to the two red horizontal trading ranges at the bottom of each chart. As you can see gold has been stronger than silver as it’s testing its mid line while silver still hasn’t broken above its thin black dashed horizontal S&R rail yet. The red horizontal trading ranges clearly shows you what my goal is for this intermediate move which is the top red rail. Again we’ll have to see what happens if we get there.
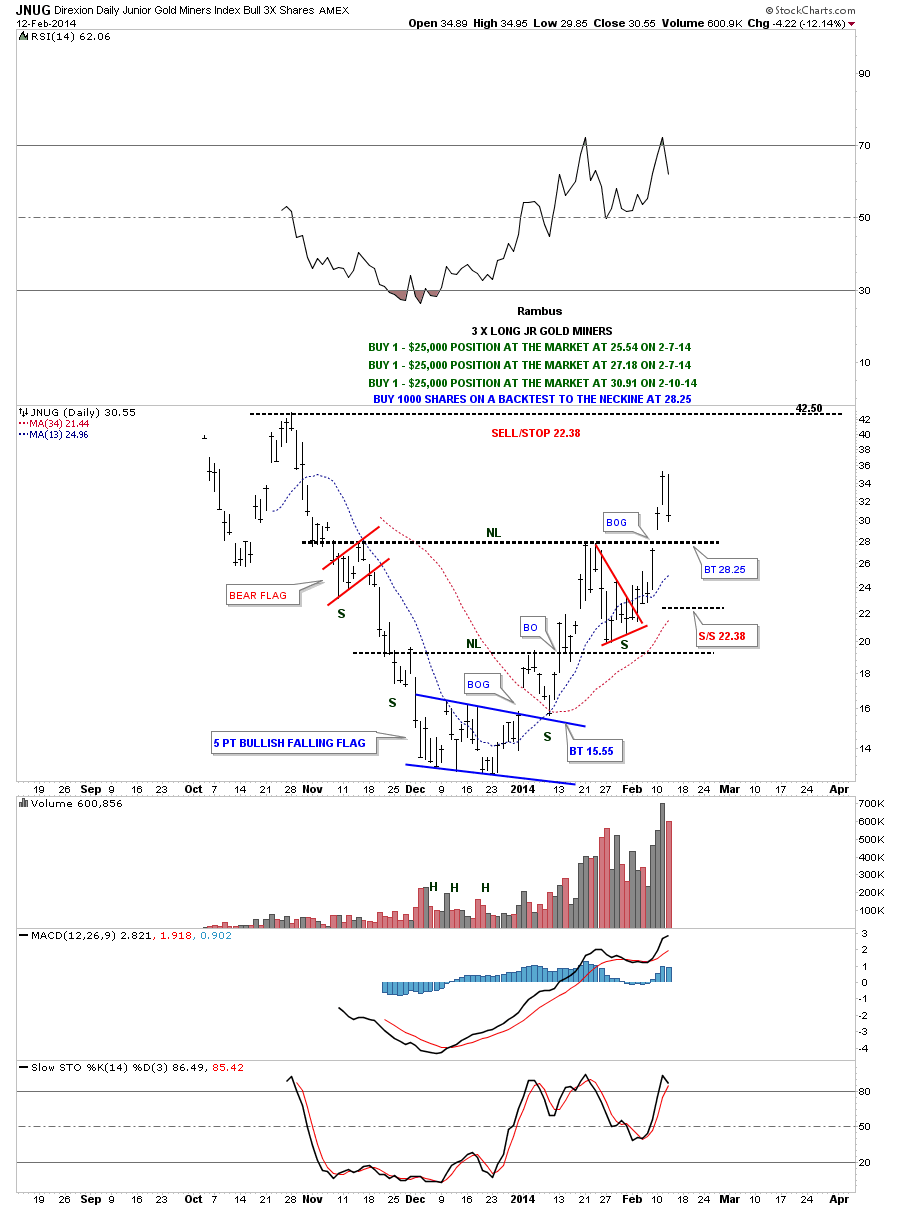
Below is a daily chart for JNUG that shows our three buy points so far. When we took our third buy on Monday I put an order in to but 1000 shares on the backtest to what I hope will be the neckline of a very large inverse H&S bottom. Notice the smaller inverse H&S bottom that now makes up the head portion of the potential very large inverse H&S bottom. So far this move is going as expected.
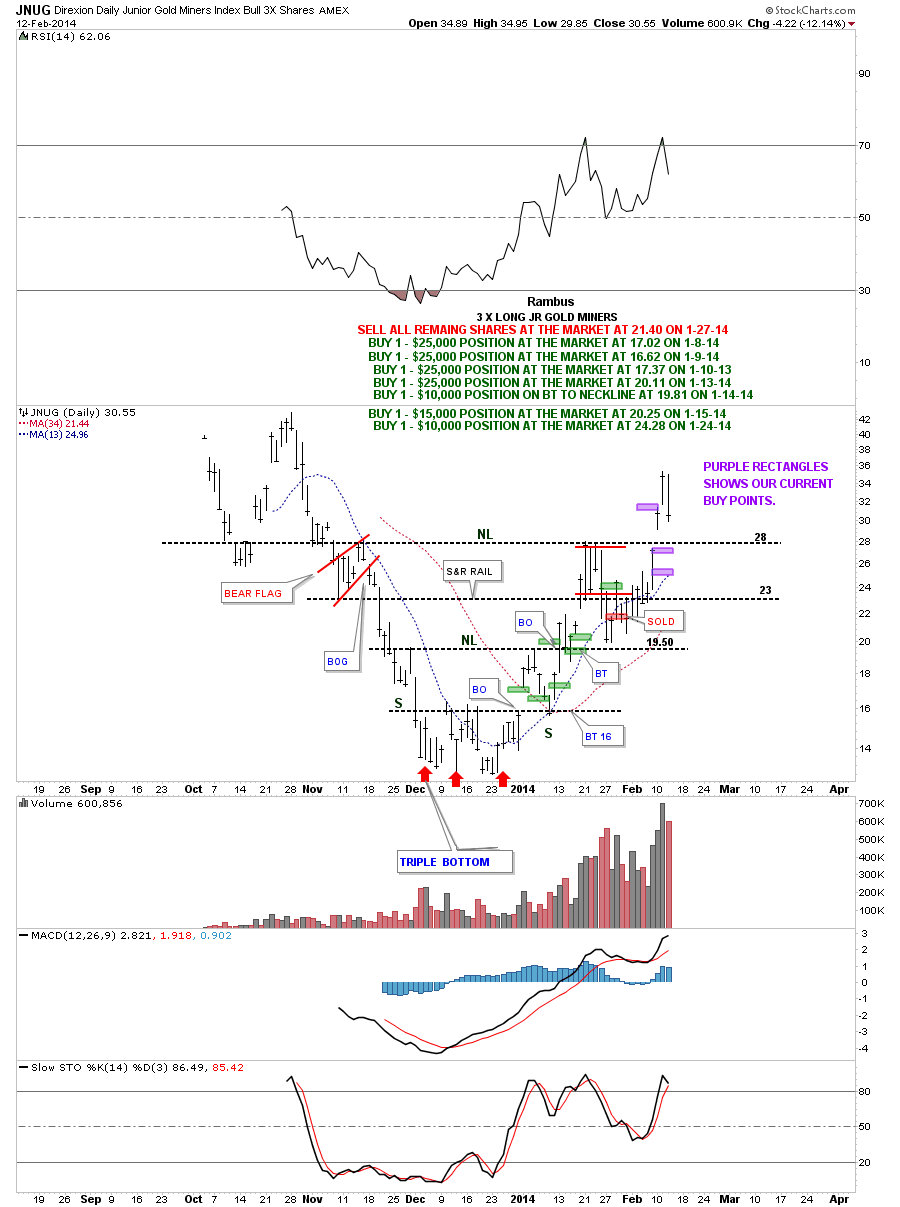
This next chart for the JNUG is a “What would you have done chart” that shows the last 7 buy points on our last trade setup. The green rectangles shows where we bought . As you can see there were 7 green rectangles that show the buy points and the one brown rectangle that shows where we sold. There were 6 positive trades below the brown rectangle and one losing trade above the brown rectangle. My question is, what would you have done in this situation? It’s easy to see in hindsight what to do but in real time it’s a much different story. At any rate I just wanted to show you this can be a game of inches sometimes where you can be so close but so yet far away. As you know we have taken on three new positions so far, purple rectangles, to try and get back in sync and if we get a complete backtest to the neckline we’ll have our fourth.
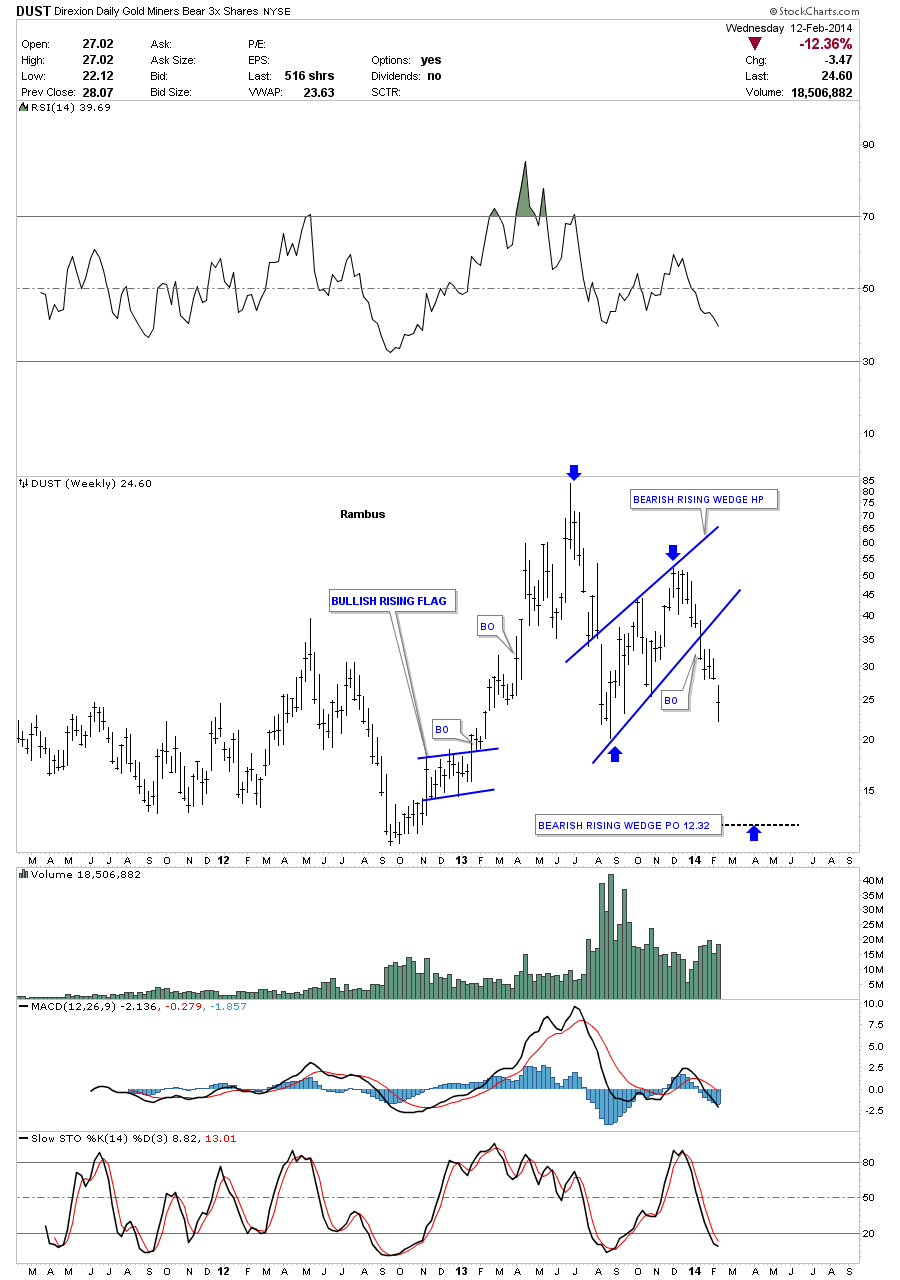
Lets look at one more chart as it’s getting late. The last chart I would like to show you is a weekly look at DUST which is a 3 X short the big cap PM stocks etf. If the blue bearish rising wedge plays out as a halfway pattern to the downside we should see a price objective down to the 12.32 area.
So far nothing is broken for our long positions in the precious metals complex. As long as the support rails do their job we just have to hang on for the ride. Remember two steps forward and one step back. All the best…Rambus