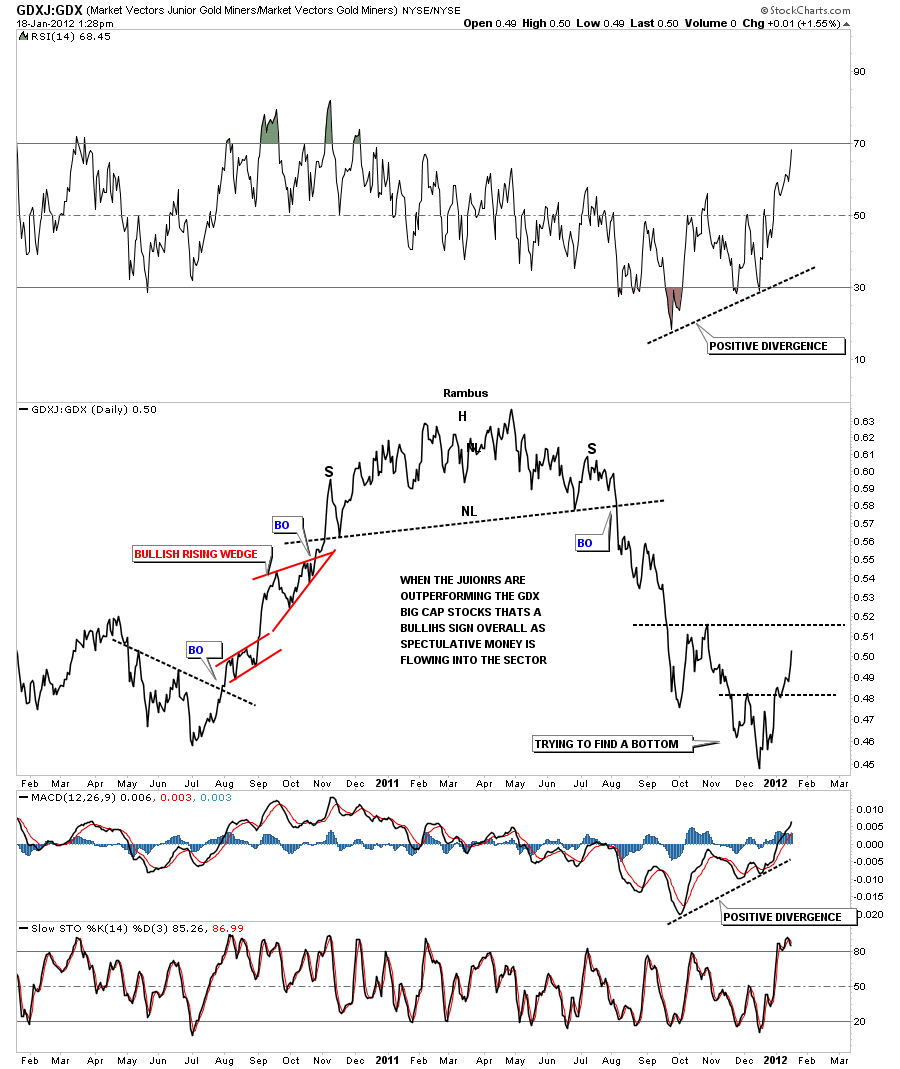
I don’t know how many have noticed that the GDXJ, the junior precious metals stock index, has been holding up better than the big caps for the last month or so. This is a very positive event taking place right now. What this ratio is saying is that when money starts flowing into the more speculative small cap stocks the whole precious metals sector, as a whole, will start to benefit. You can see on the chart below the juniors started to outperform the big caps in the middle of December and have not let up yet. I believe this is a very positive situation taking place right before our very eyes. The big H&S top that was made last year is why the precious metals stocks, as a whole, have been trading so weak until the middle of December. There is time to be in the precious metals stocks and a time to let them correct. With the GDXJ:GDX ratio getting stronger that is another reason I’ve been becoming more bullish on the whole precious metals complex. Sometimes these clues don’t present themselves until the last minute but when they do its time to act. Note the positive divergence on the RSI and the MACD.
GDXJ:GDX daily line chart showing the small caps outperforming the big caps, a positive sign going forward.
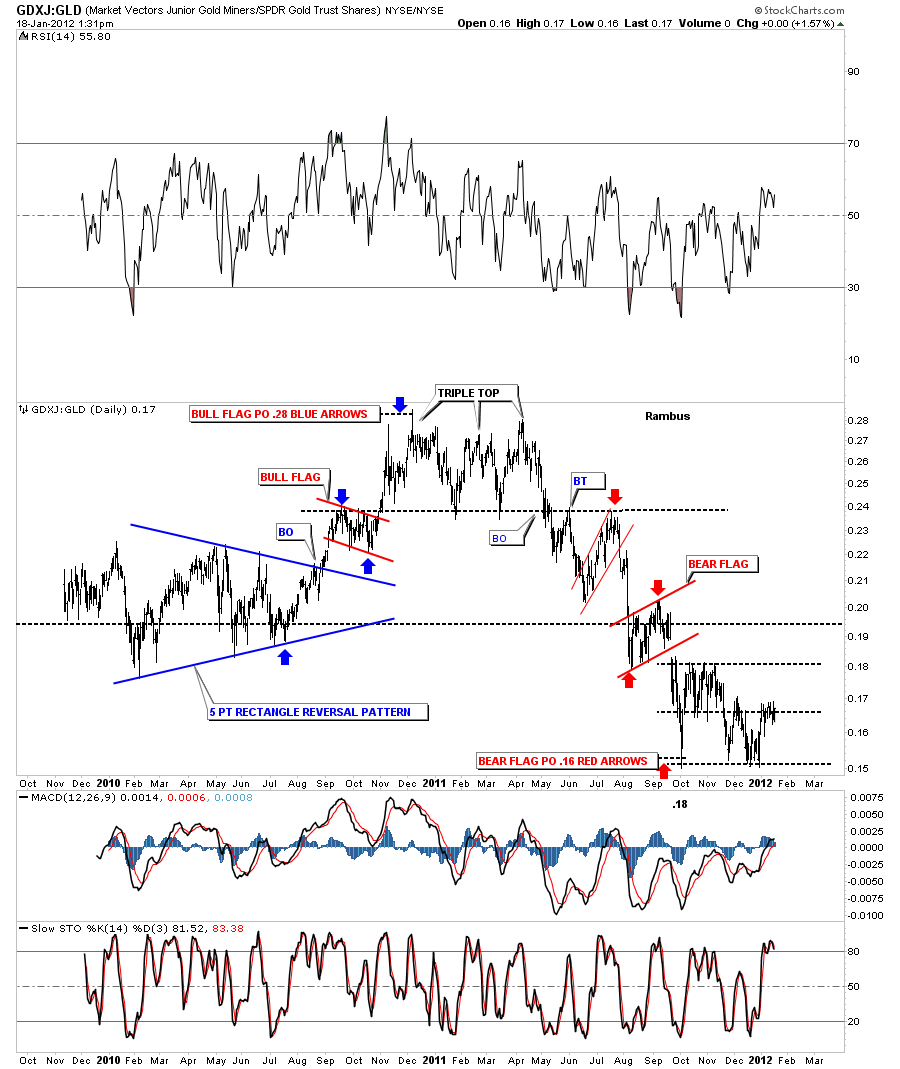
Lets take a quick look at the GDXJ:GLD and see what the small caps are doing compared to gold. On the chart below it looks like the GDXJ is trying to put in a bottom to the price of gold. If this ratio really starts to rise that would be a very powerful sign. It would mean its time for the small caps to start playing catch up and start outperforming gold, which when all the stars are alined just right for the juniors, that is when the big money will be made.
GDXJ:GLD daily look showing the juniors are trying to put in a bottom to gold which would be a very positive sign.


