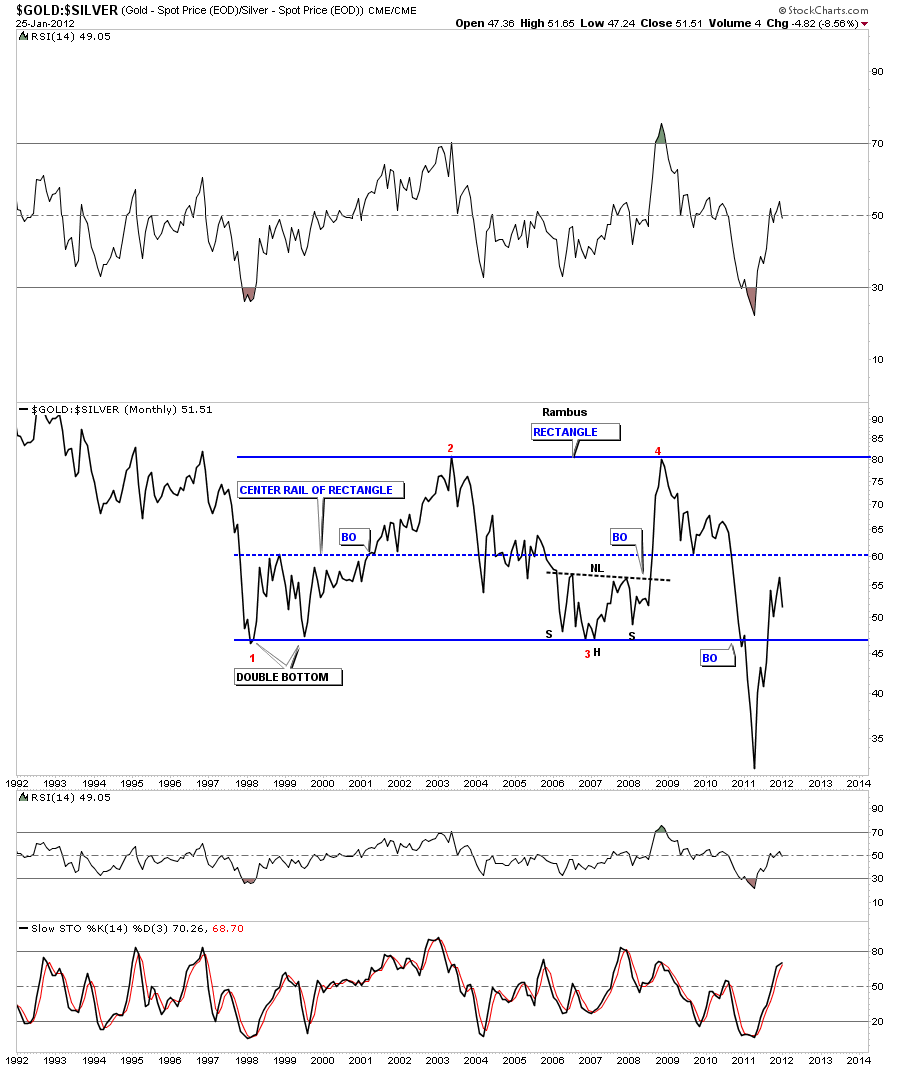
This week I’m going to look at the gold to silver ratio as requested by Sir riscott63. The first chart we are going to look at is a long term 20 year line chart that shows shows a huge 13 year rectangle. When this ratio if falling that means silver is outperforming gold. The ratio hit a high during the big crash in 2008 where gold had been outperforming silver for the last 2 years or so. From that high in the fall of 2008, point #4, silver went on an unprecedented run that took the ratio all the way back down to the bottom of the rectangle where it didn’t stop at the previous lows. When it broke the bottom rail of the rectangle it confirmed the rectangle was indeed a valid pattern. That low coincided with silver hitting it’s high for this bull market at 50.
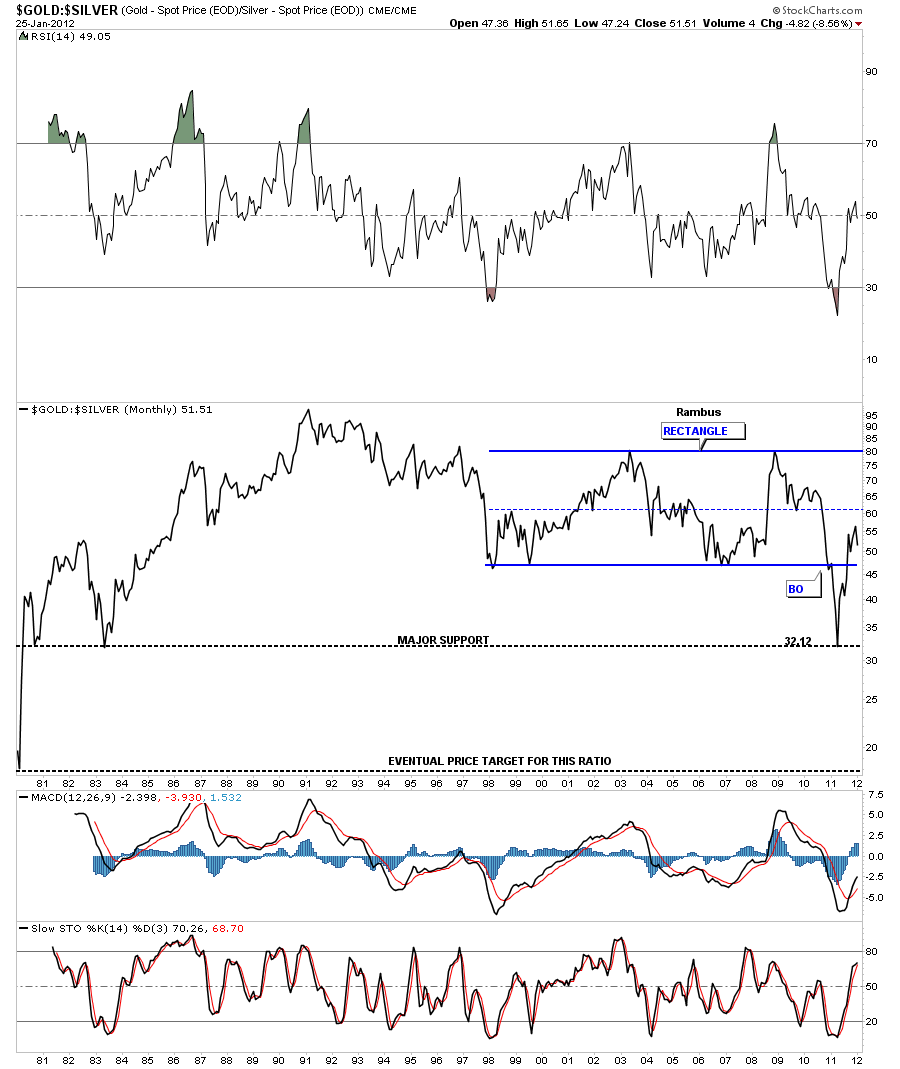
Below is a 30 year chart of the gold to silver ratio showing where silver finally bottomed out at against gold that went all the way back to the old bull market in 1980 and again in 1983. This chart really shows its been a very long time since this ratio has been as low as it was last year. Whenever I have a rectangle pattern I always draw in a thin dashed rail at the middle point of the rectangle, Sometimes the center point of a rectangle will act as resistance or support depending on which direction the move is taking place. Even after a clear breakout, a counter trend rally can make it all the way back into the center of the rectangle where it may reverse itself again in the direction of the previous move. I believe this gold to silver ratio maybe setting up this scenario. If you put this line chart to a bar chart you will see this ratio did make it up to the center dashed blue rail where it has reversed and maybe starting to head back down again. It could very well be that this ratio may work its way lower down below 20 where I believe a ratio of 15 ounces of silver could buy one ounce of gold when its all said and down. This would be pretty close to the normal ratio that had been in place for many hundreds of years. If this is the case then the ratio is showing that silver will be the place to be invested over the coming years.
Below is the gold to silver ratio chart, that I built several years ago, comparing the ratio to the SPX. This chart shows the clear implications of how the stock markets behave when silver is outperforming gold. As silver is used both as a commodity and a precious metal it plays a double role. When the stock market is in rally mode that puts pressure on silver as a commodity because it is used in alot of different technologies. So when we see the stock market going up we generally see the gold to silver ratio falling. As you can see from the 2008 stock market crash low silver has been outperforming gold, for the most part, as the stock market started a new bull market. You can also see when the ratio bottomed during our latest correction last year, and had a little counter trend rally, the SPX formed it’s correction low. What we want to see going forward is for the ratio to keep falling and the stock markets to go higher. If the stock markets are indeed embarking on a bull market run the gold to silver ratio should fall pretty low. Maybe all the way to the historic average around 15 oz silver to 1 oz of gold. This ratio chart will give us something to watch as the bull market unfolds for the stock markets and for silver. Note how the gold to silver ratio broke the bottom support rail during silver’s near parabolic move up to 50. Now that this long term support rail has been broken it should now be easier for the ratio to break below the bottom support rail and continue lower.
I hope this answers your question on who will be leading this next leg up in the precious metals. If the gold to silver ratio keeps falling the stock markets will continue to rise and silver will outperform gold, for the most part, going forward… All the best Sir riscott63…Rambus


