I guess today is a good day to look at how support and resistance works. In the other two post this morning, on SLV and the UUP, I showed how resistance turns into support when broken and how support when broken turns into resistance. The last time I showed this chart of the Dow we had just broken out from the red bullish rising flag pattern. Notice where that bullish rising flag formed. Right on the neckline of the H&S consolidation pattern. Again resistance turns into support when broken to the upside. You can checkout the other black dashed trendlines on the chart below to see several other fine examples of how support and resistance reverses its role once broken.
Dow daily backtest to top rail of bull flag looks complete.
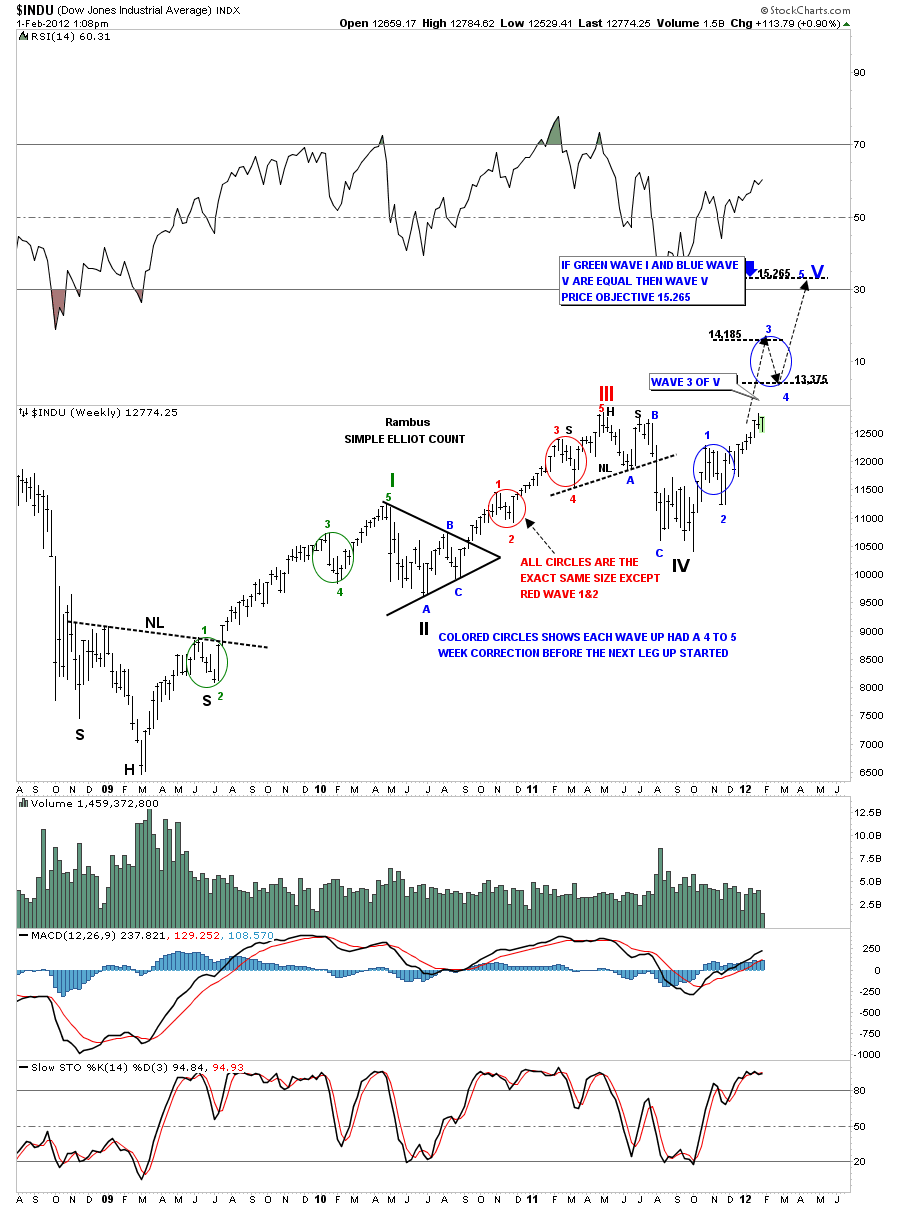
While were on the Dow lets take a quick look at the Elliot Wave count I showed several weeks ago in the weekend newsletter. So far nothing looks broken. What we need to see, fairly soon, is a breakout into new highs for this move, above the 2011 H&S top. This move should be fairly straight up until we get to the top of wave 3. If the pattern stays the same we should get a 4 to 5 week correction, wave 4 down blue circle, and then the last move up to finish off wave 5 where we should get a bigger correction.
Dow weekly Elliot wave count.


