
Tonight I would like to take a look at the US dollar as its been showing a little strength lately. Over the last month or two I’ve been showing some commodities indexes that have been very weak which I think has to do with the strengthening US dollar. The move up in the US dollar hasn’t been that big yet but it could be in the beginning stages of a rally phase that could send this index higher. How high is anyone’s guess but any strength will have an impact on the commodities sector and possibly the precious metals complex. It has been awhile since we looked at the US dollar so lets take a look under the hood and see what we can make of the reserve currency.
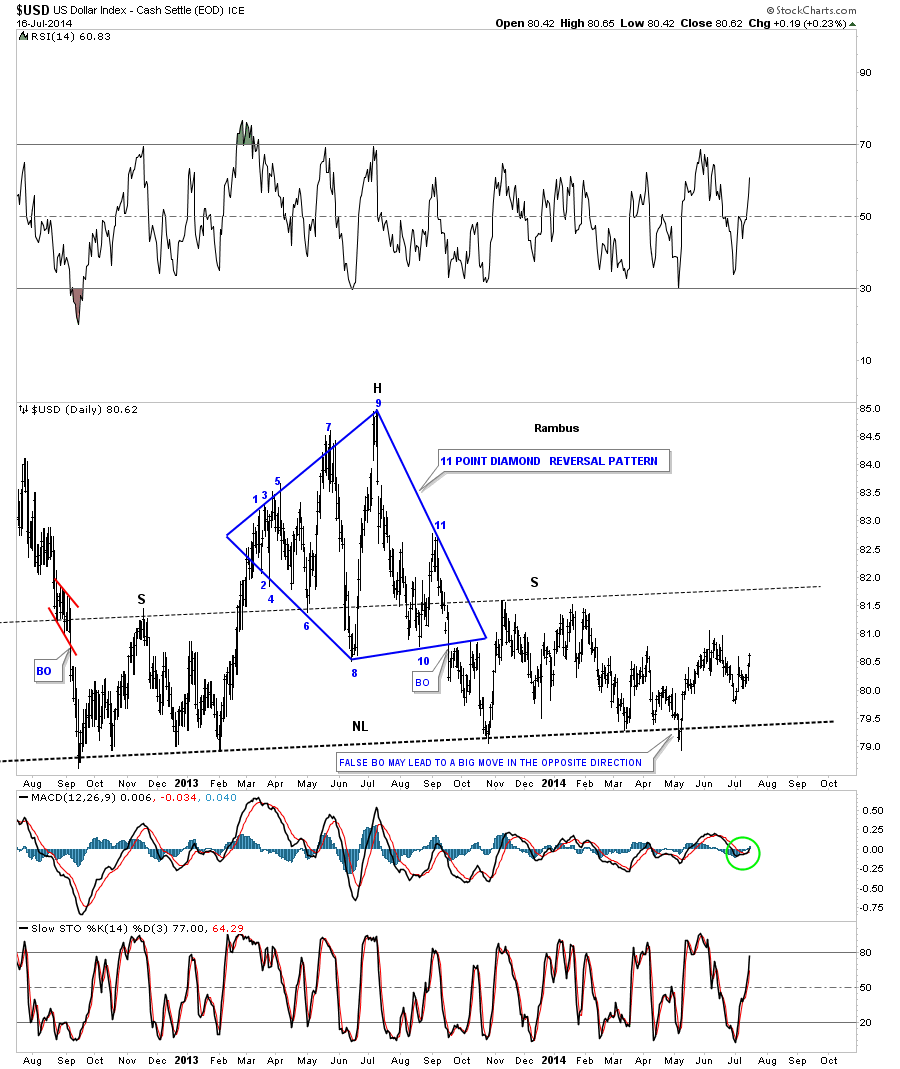
The first chart I would like to show you is a long term daily chart we were watching very closely back in May of this year. At the time it looked like the US dollar was building out a massive H&S top formation. As you can see the neckline was broken to the downside but quickly reversed direction and rallied back up above the neckline. At the time I said that was probably a very bullish development. When you get a false breakout like that and the price action reverses quickly that is generally a sign of exhaustion. So far that has been the case.
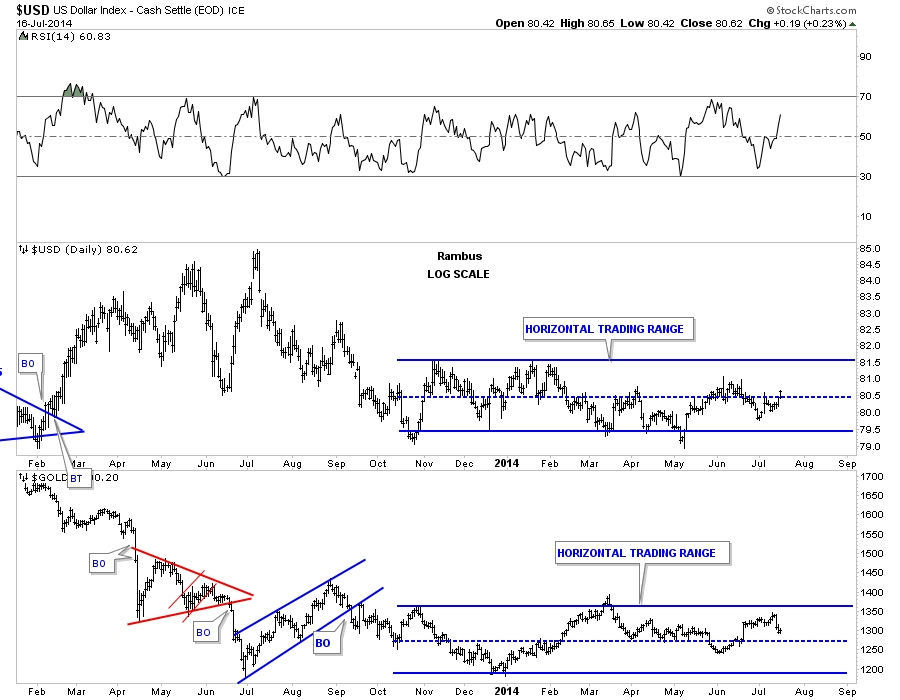
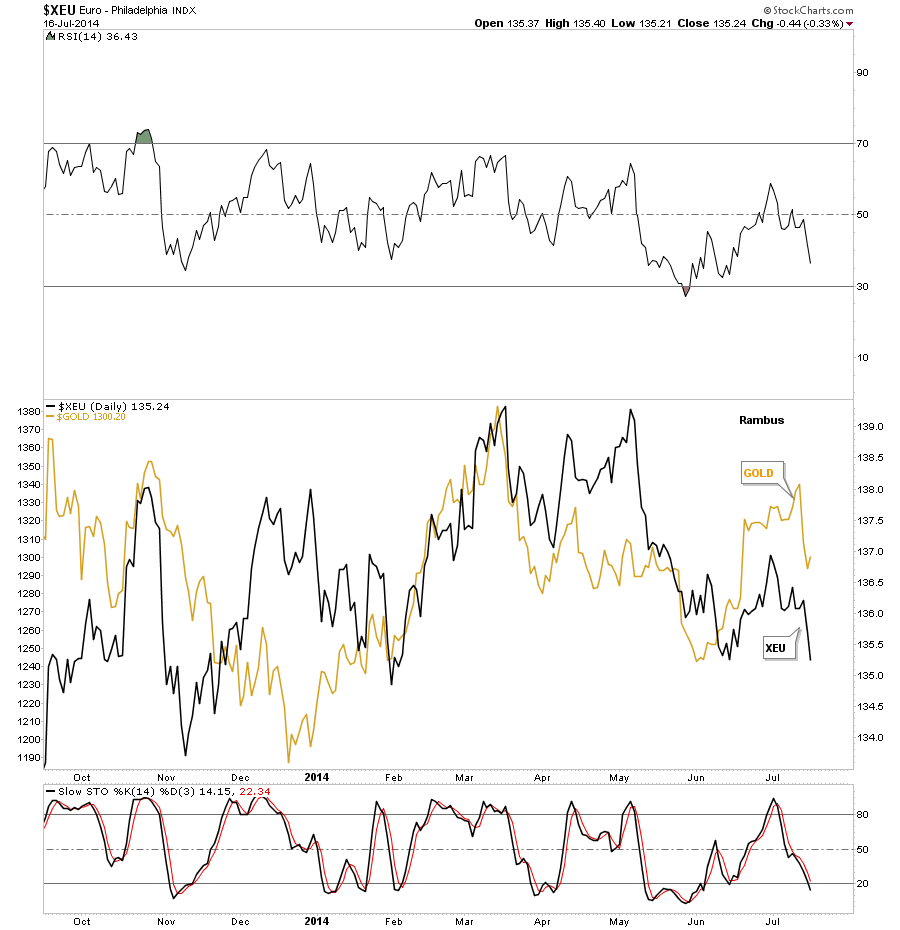
The daily dollar chart is really quite boring for the short term as there aren’t any good chart patterns to be seen at this time. The longer term daily chart does show a big horizontal trading range going all the way back to November of 2013 which corresponds with a similar sideways trading range for gold. It’s not perfect but you can see the inverse movements between the US dollar and Gold. If you look at the last month of trading for both the US dollar and gold, on the combo chart below, it’s very clear that they are moving in the opposite direction.
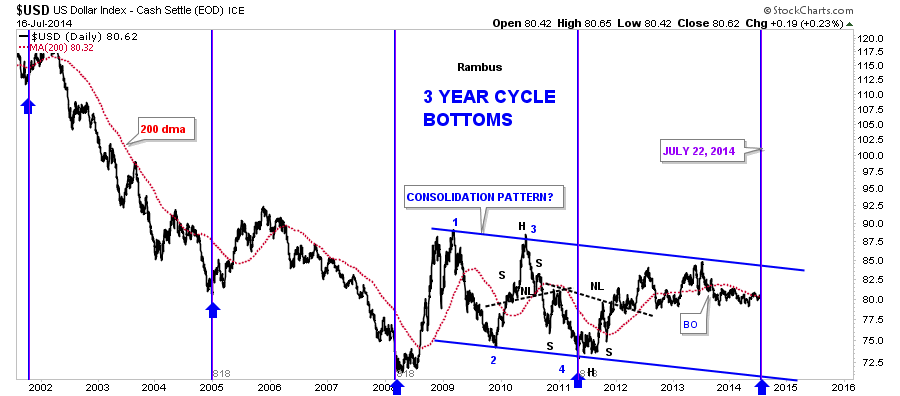
This next chart for the US dollar I’ve been following for many years that shows a three year cycle low that comes in like clock work. It’s hard to believe that the next three year cycle low comes in on July 22 of this year. Please notice the three year cycle low in 2008 and 2011 which coincides pretty close to important tops in the PM sector and commodities. Are we going to experience the same thing again three years later from the 2011 cycle bottom? Also the US dollar is now trading above its 200 dma. It’s something I’m keeping a very close eye on.
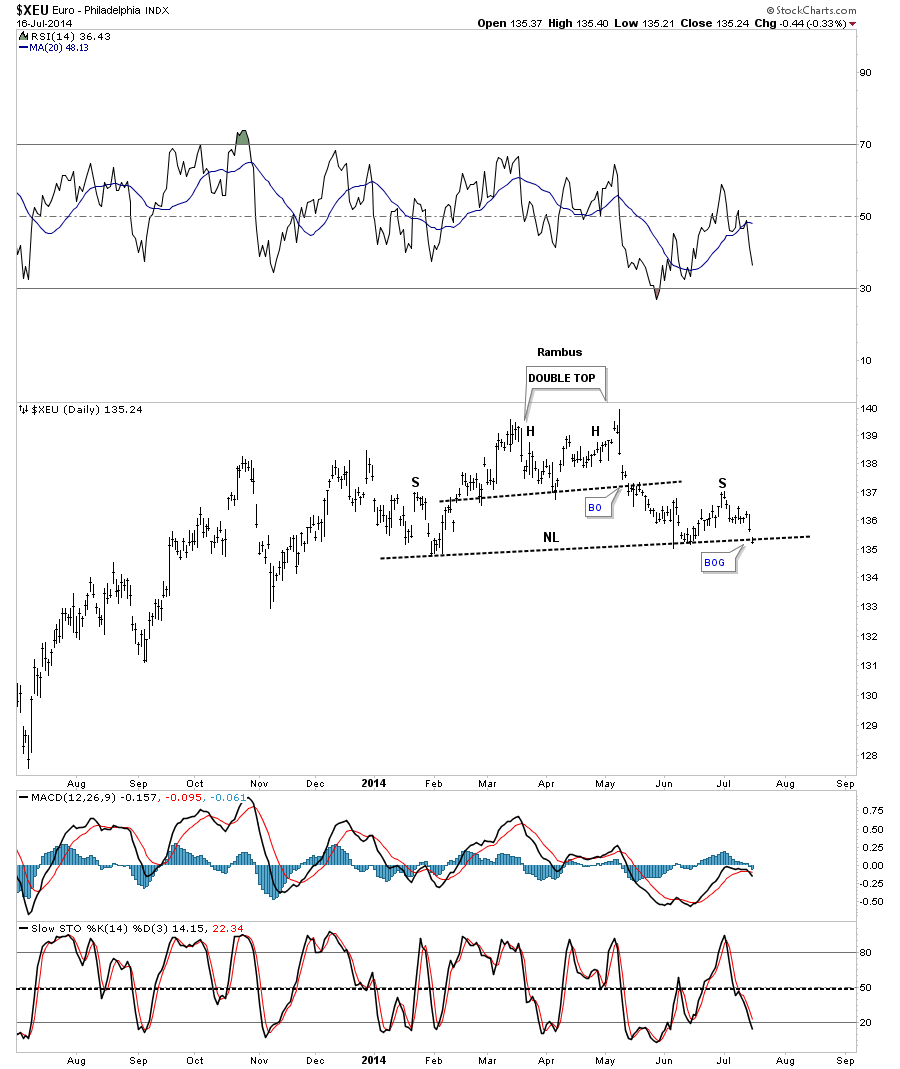
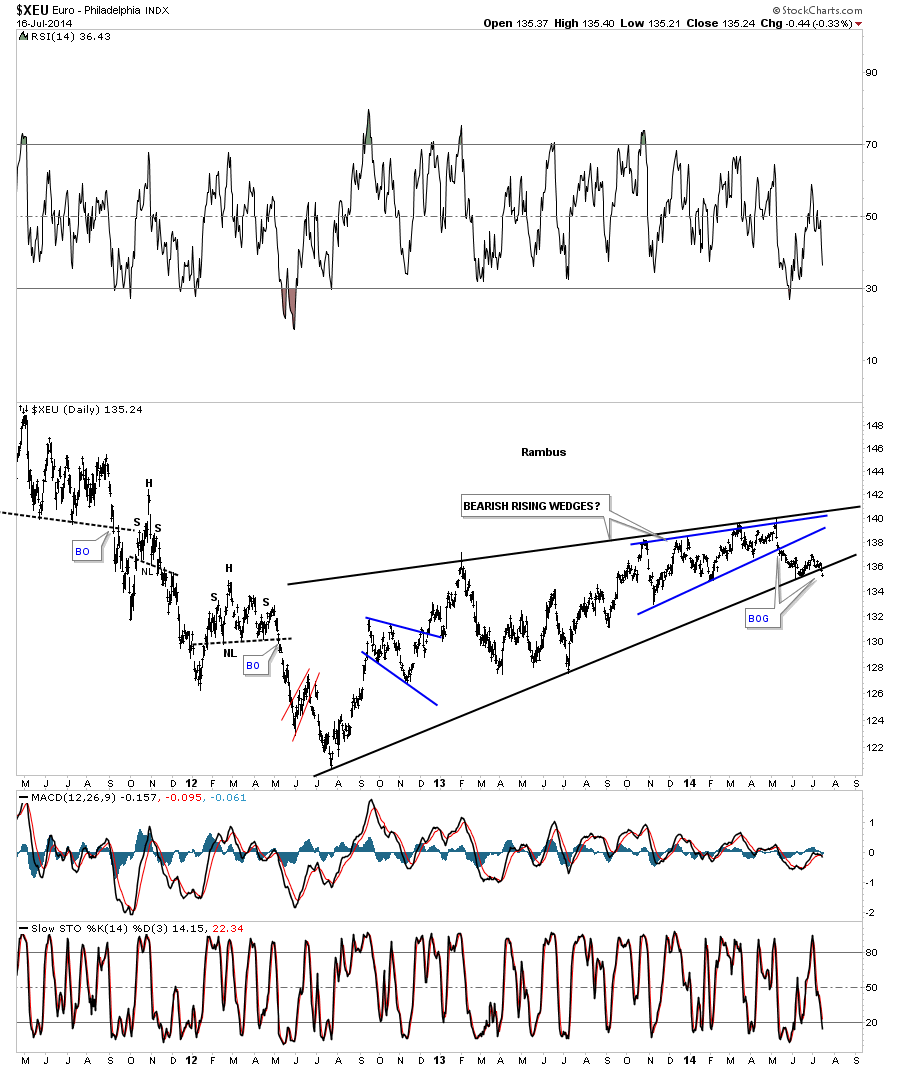
If we’re going to look at the US dollar we need to take a close look at the XEU as the euro is the biggest component in a basket of stocks for the dollar. Unlike the daily chart for the US dollar, that doesn’t have a decent short term daily pattern in play, the euro does. Today it looks like the euro broke out of a H&S top with a small gap. This could be an important top that has just formed as I’ll show you in a bit as to why.
Below is a very long term chart for the euro that shows two bearish rising wedges, one inside the other. Notice the last bar on this chart. It’s the same small gap that accompanied our little H&S top on the chart above. Now you can see why this is such a big deal. If the euro starts to drop precipitously it will have a positive affect on the US dollar which will have a negative impact on the commodities complex.
This next chart I’ve overlaid the euro on top of gold so you can see the similar correlation. Again it’s not perfect by any means but it does give you a sense that when the euro is strong or weak so is gold. You can do the same thing with the other important currencies and get a similar result. Again something I’m keeping a close eye one.
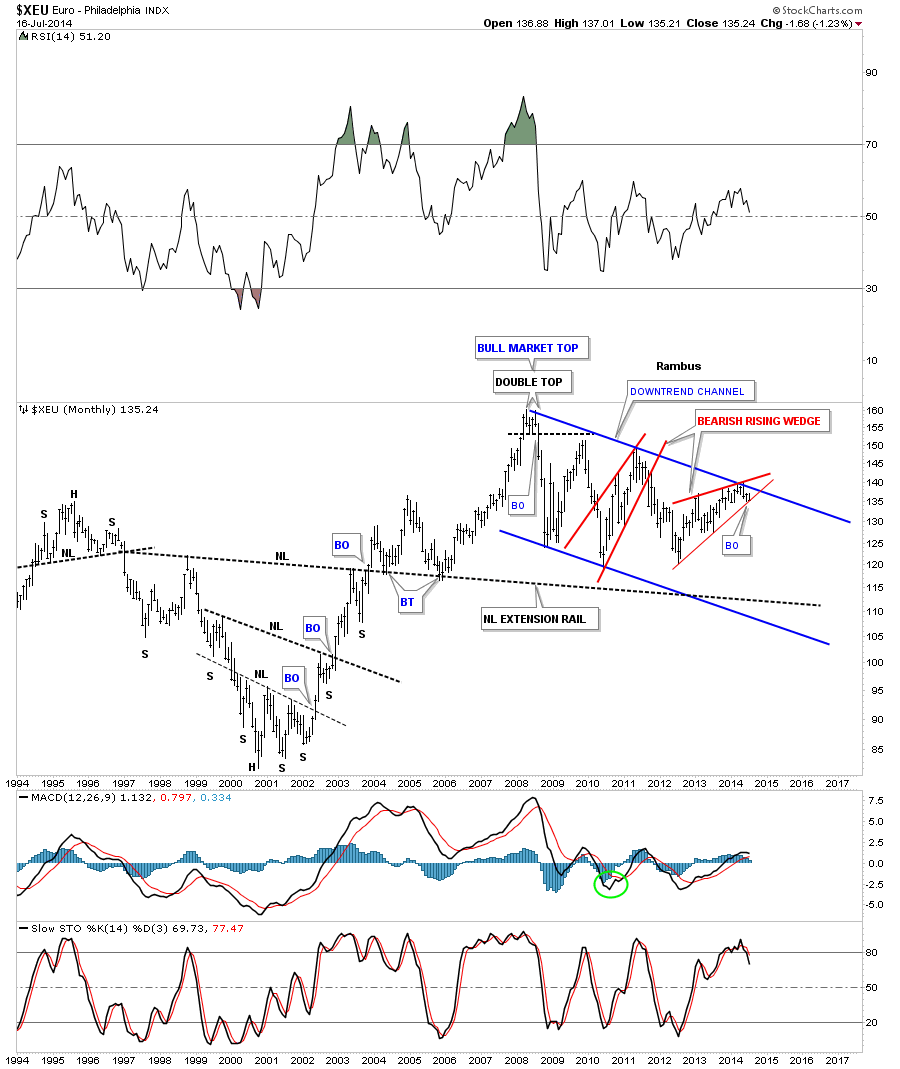
This last chart is a very long term monthly look that shows you just how precarious the situation is with the euro. I showed you a bearish rising wedge earlier in this post for the euro that just broke the bottom trendline today with a gap. This is the same bearish rising wedge only on the monthly look. You can”t see the gap on this chart but the daily chart does show it’s now breaking the bottom trendline. This could be a very big deal.
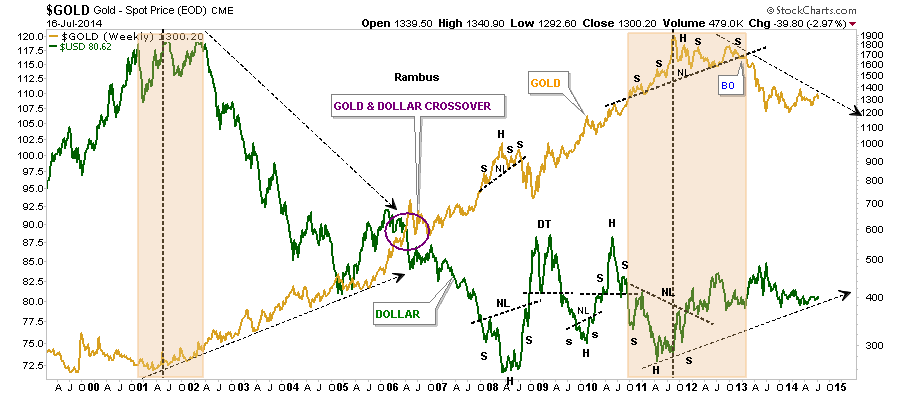
Below is a very long term chart in which I’ve overlaid gold on top of the US dollar. This chart clearly shows you the inverse correlation over the long haul. It doesn’t feel like it but the inverse correlation has been pretty good since the commodities complex topped out in 2011 along with the US dollar bottoming about the same time.
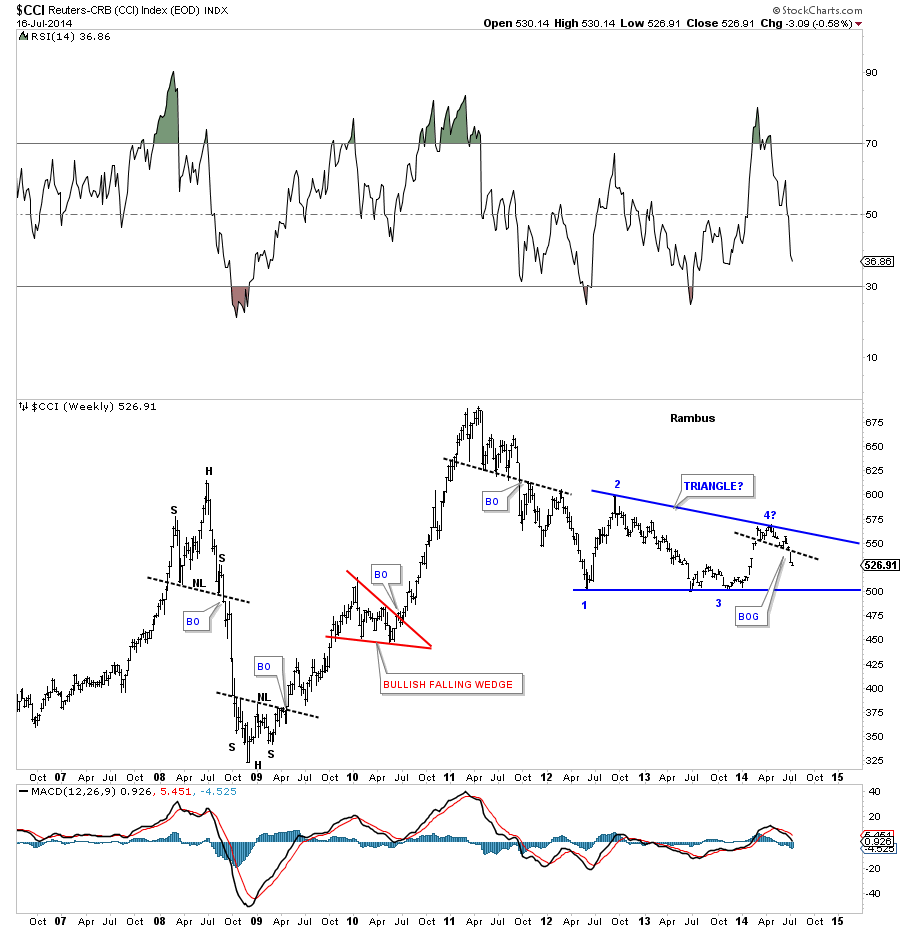
Below is the CCI commodities index we’ve been following that has been showing weakness since the first of the year or so.
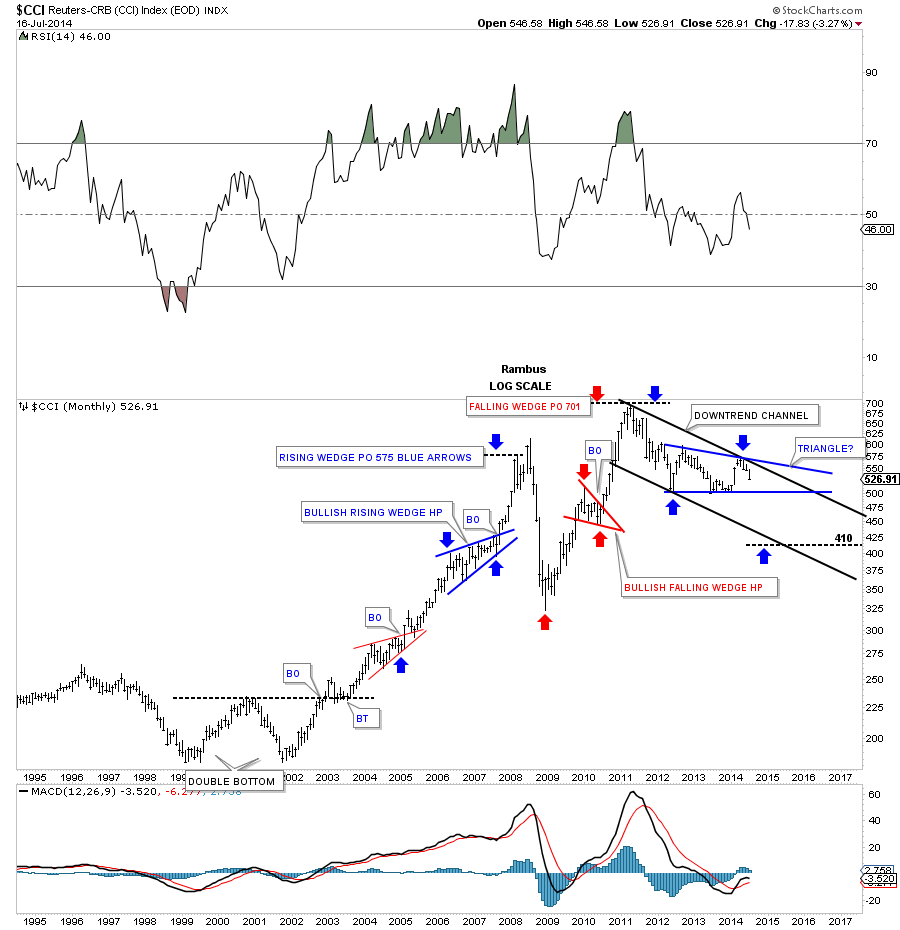
CCI monthly look.
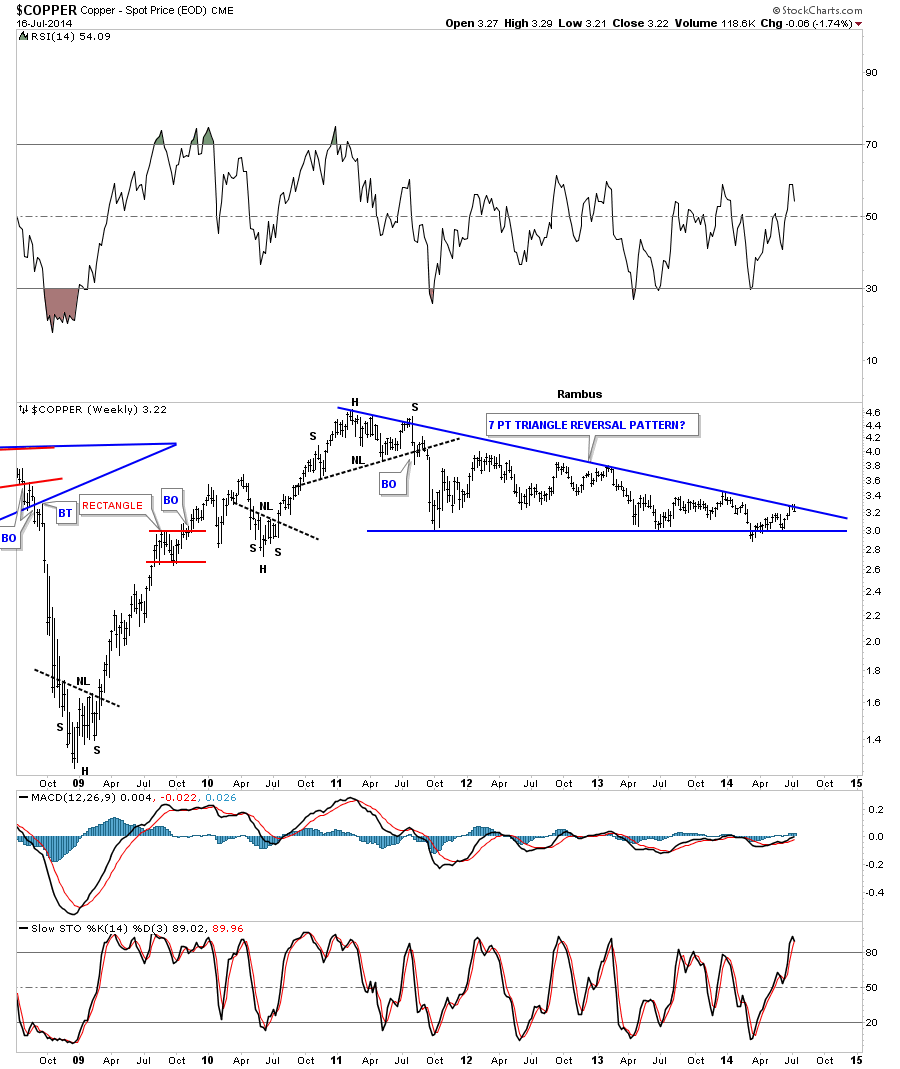
Lets take a quick look at copper as it’s one of the more important commodities to help give us direction. As you can see it has been building out a massive triangle pattern that started to form way back in 2011 when the commodities complex topped out. As you can see it’s testing the top rail which would be the 7th reversal point if it holds which would make this triangle a reversal pattern to the downside. On the other hand if it breaks out through the top rail that would be very bullish for the different economies of the world.
The US dollar is at a critical juncture right here and now. Based on the XEU, which is just starting to break down, this would imply that the US dollar will show strength in the coming months. The weakness in the commodities complex has already shown up which is suggesting deflation is more pronounced than inflation at this moment. There are areas of strength in the commodities, such as the industrial metals, which have been doing pretty good, but other areas like the agricultural side of the commodities complex is doing very poorly. How will the precious metals complex fair is the million dollar question. Will they buck the trend and move to the beat of their own drummer? Looking back in hindsight we will know the answer to that question. Right now we have to be ever so vigilant looking for clues that may help us understand the answer to that million dollar question. All the best…Rambus