
Sometimes there just aren’t enough hours in the day to get everything done one wants to do.
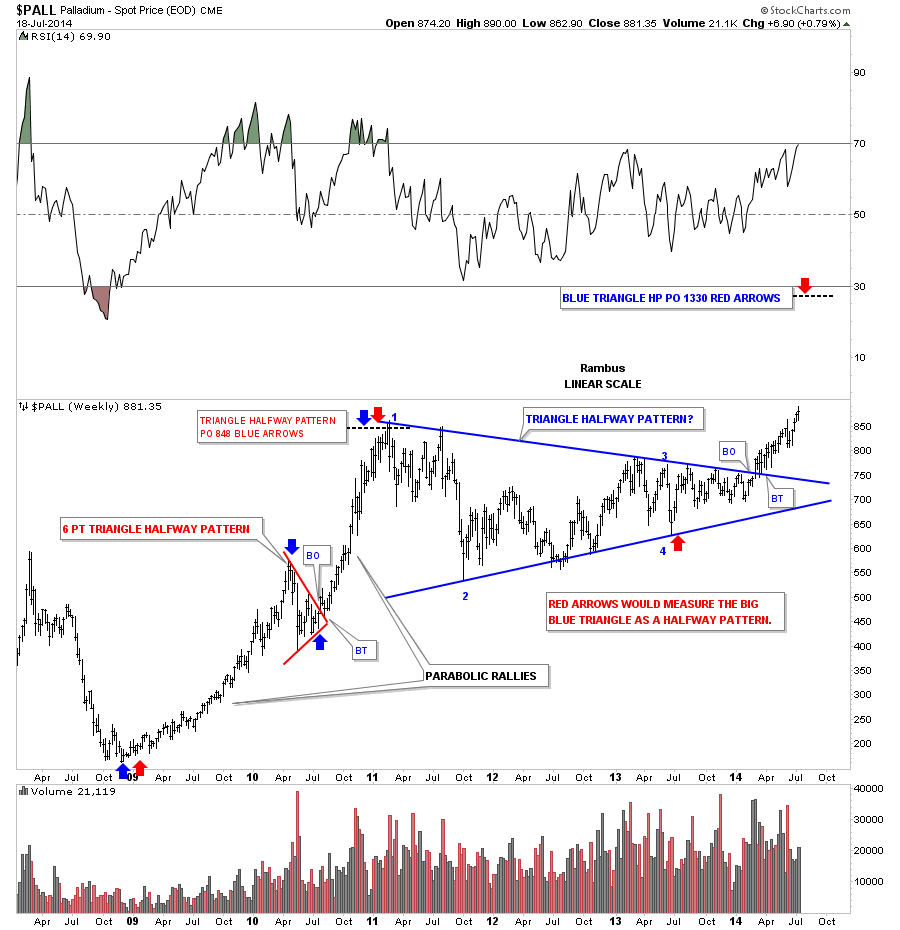
Today I would like to look at Palladium as it has been the leader in the precious metals complex. When Palladium starts an impulse move up it usually wastes little time and rallies very strongly. Below is a weekly chart that shows the latest triangle consolidation with the breakout and the impulse move that has been in progress since the first of the year. Note the two parabolic moves with the first one starting at the 2008 low and ending at the first reversal point on the red 6 point triangle consolidation halfway pattern. After the red triangle finished building out, the second impulse move began that also went parabolic leaving the red triangle as a halfway pattern as measured by the blue arrows. It wouldn’t surprise me if the big blue triangle that Palladium just broke out of at the first of the year doesn’t workout as a halfway pattern starting at the 2008 crash low with the top at 850 being the first impulse move up.
Below is a monthly chart for PALL that puts our blue triangle in perspective within the big picture. The all time high was made way back in 2000 along with the tech bubble and then crashed like just about everything else. PALL is now taking out the previous highs made back in 2010 and 2011 which is showing incredible strength when you compare where gold and silver are relative to their 2011 highs. At some point I expect PALL to start forming a possible halfway pattern after it move a little higher which we will then be able to fine tune a possible price objective. All the best…Rambus
