For the last two months, and especially the month of September, I’ve been trying to prep you for the impulse move that we currently find ourselves in right now. You don’t have to wait any longer wondering when it’s going to begin. We’ve been in this impulse move down since the last high was made on August 14th, which is the 4th reversal point in that blue triangle consolidation pattern, we’ve been following so close. I’ve been showing you countless H&S top patterns in all the big cap precious metals stocks a long with smaller consolidation patterns that are breaking out. I’ve shown you how the Japanese Yen and the eruo that have been collapsing and how closely gold and precious metals stock indexes are following the Yen lower. I don’t know how I can make it any more clearer that the move we’ve been waiting for, for 15 months or so, is already six weeks old.
A stock or stock market can do one of four things. First it can build out a topping pattern, 2nd a bottoming pattern, 3rd a consolidation pattern, all of which are followed by number four, an impulse move. This is how markets move. You can’t have a big bull market if you don’t have a big base and you can’t have a big move down without a big topping pattern. The bigger the pattern the bigger the impulse move that follows the breakout. As a trader, one of the most important things you have to learn is, which one of the four phases you are in.
Lets start by looking the long term monthly chart for the HUI that shows you exactly what I described above about the four different phases a stock or market can be in. Notice the massive inverse H&S base that was made at the end of the last bear market that took roughly five years to build. If we were paying attention to that massive H&S base we knew a new bull market was beginning. Big pattern big move. Note the vertical move once the neckline was broken to the topside. That was the first impulse move. After that impulse move became exhausted the blue triangle consolidation pattern began to form that took well over a year to complete. Again, once the triangle consolidation pattern finished building out it was time for the next impulse move to begin. Again, note the vertical move out of the blue triangle which was the next impulse move up.
This repeated all the way up to the 2008 H&S top that reversed the bull market and led to the big crash. Because it was a crash, in this case the HUI had what they call a V bottom. You normally don’t see moves like that in normal behaving markets.
Now I want to focus your attention to the massive H&S top that took over 3 1/2 years to build and broke down in April of 2013. Again, notice the near vertical move down once the H&S top gave way. Like the impulse moves up in the bull market years the HUI is repeating the same process only this time in a bear market. You can see our blue triangle that has been consolidating that first impulse move down out of the 3 1/2 year H&S top. The big H&S top is telling us to expect a big move down which we are currently in the middle of.
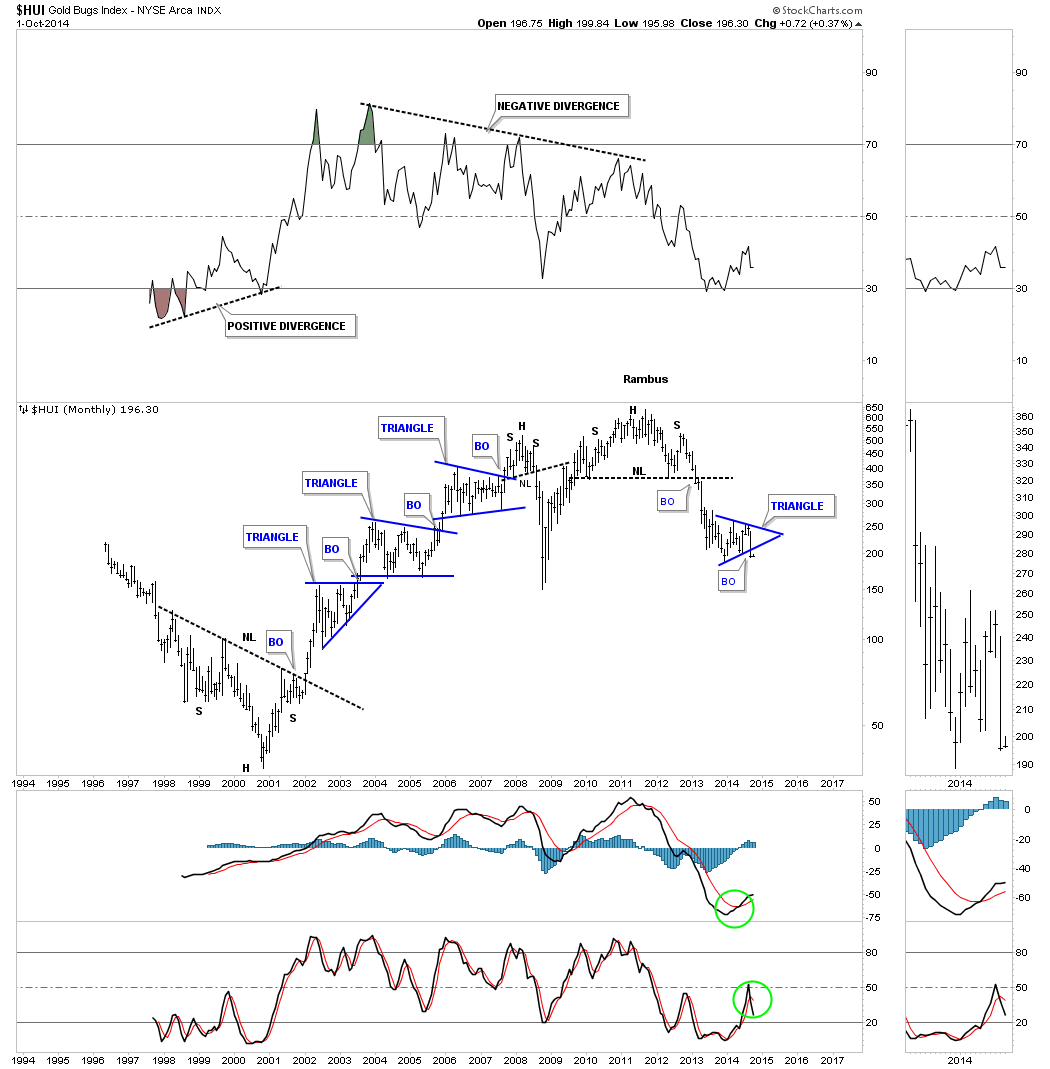
When you study the chart above ask yourself which was the better way to make money during the bull market years. Trying to trade the consolidation patterns, which stand out like a sore thumb now, but not when they’re building out, or to ride the vertical move called an impulse move. I can tell you from experience that you will make a whole lot more money riding an impulse move than you will trying to guess the next reversal point in the consolidation patterns.
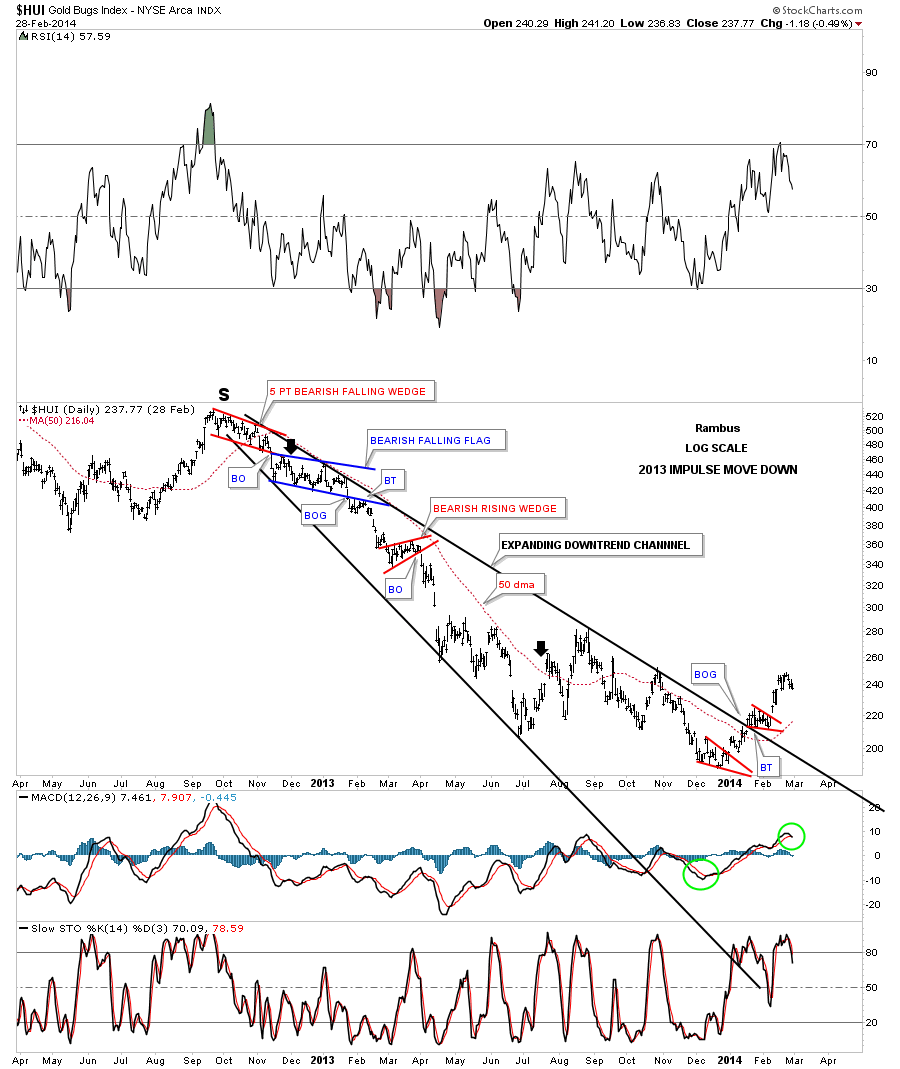
This next chart shows you the impulse move down from the top of the right shoulder to the bottom of the blue triangle on the chart above that occurred in 2013. On the monthly chart above the move looks pretty straight down but on the daily chart you can see the little consolidation patterns that formed along the way down. The black arrows shows you where our earliest members rode that impulse move down. We had a simple plan. As long as the 50 dma held resistance we would let the trade run. The trade lasted from the first week in December of 2012 to August of 2013. I can still remember several short covering rallies in which the HUI was up close to 20 point for the day. The ride wasn’t easy, they never are, but if one can hold on during an impulse move you will be rewarded for your efforts. Those that get shaken off will be looking for a place to get back in as it’s very difficult to trade an impulse move no matter how good you think you are. It’s just the nature of the beast.
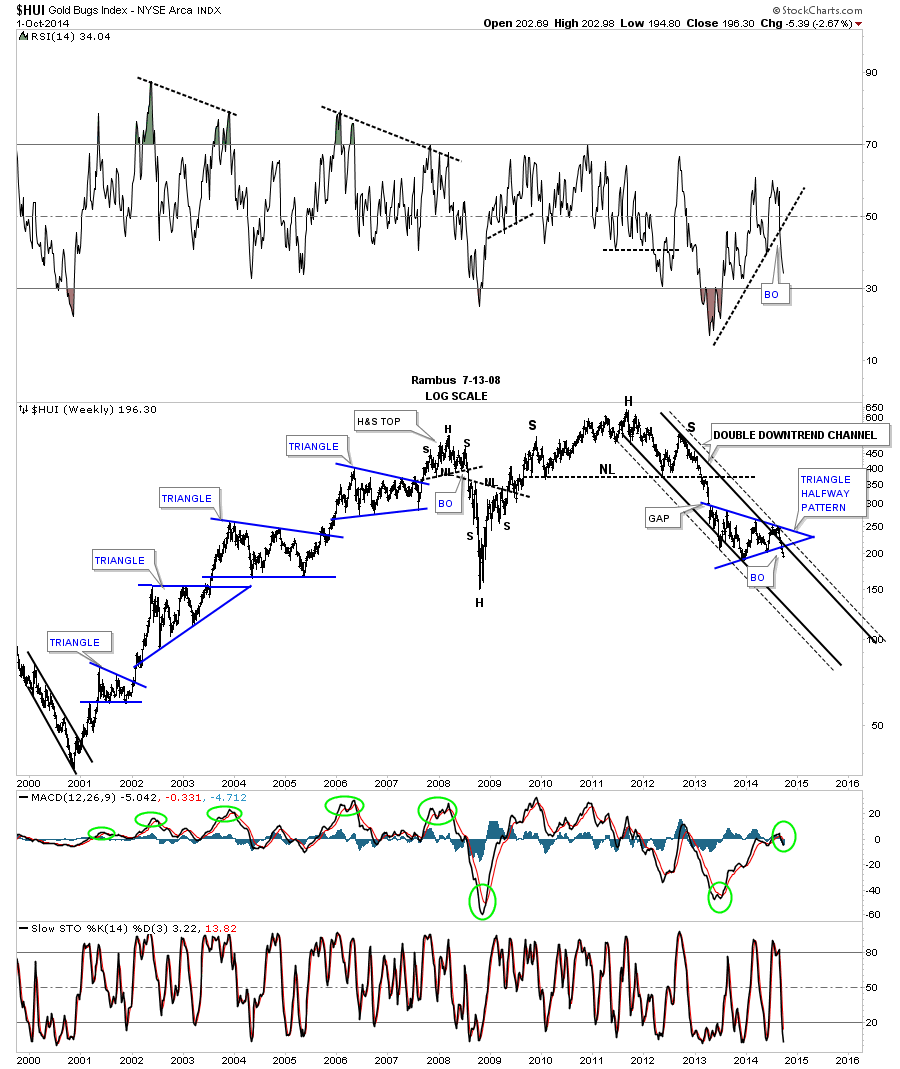
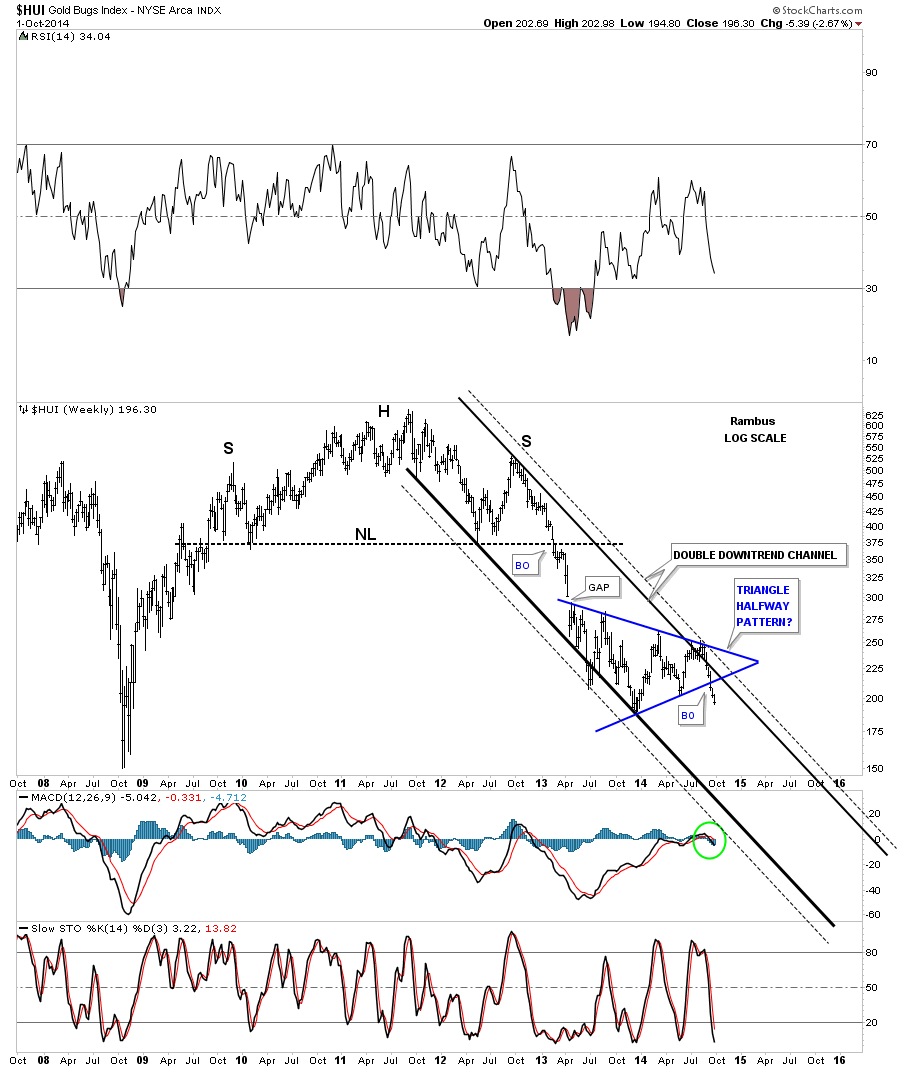
I haven’t shown you these next three charts that show how I’m perceiving our current bear market that started at the top of the right shoulder on that massive H&S top. This first chart shows you the double trendline downtrend channel that shows our blue triangle I’m viewing as a halfway pattern to the downside. As you can see we are now in our second full week of trading below the bottom rail of the triangle consolidation pattern. The impulse move actually started at the last reversal point in the blue triangle where it touches the black downtrend channel. When you look at this blue triangle think of all the blue triangles that formed during the bull market years and the impulse moves that occurred between each triangle consolidation pattern.
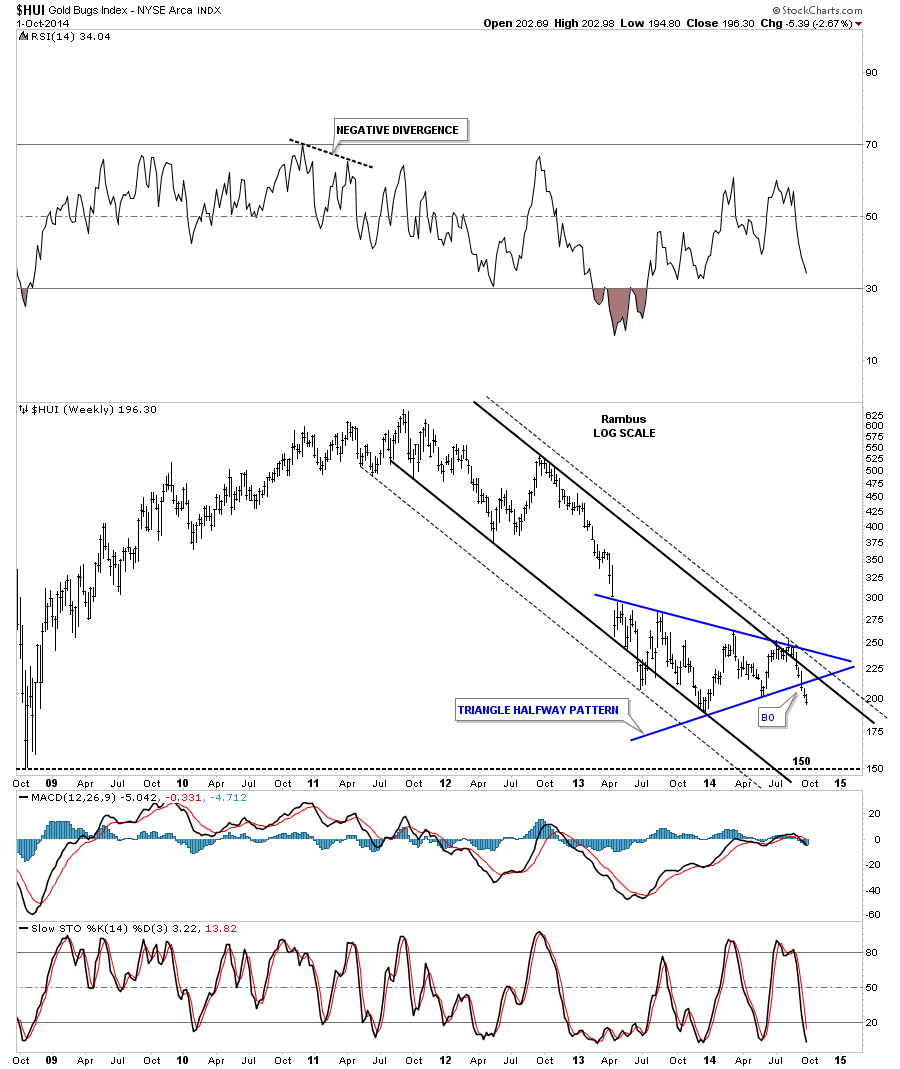
This next weekly chart for the HUI shows the exact same setup that shows the downtrend channel with the blue triangle. This next chart also shows you how our current downtrend channel and blue triangle consolidation pattern fits in with the massive H&S top. Big tops equals big moves down. Note the impulse move that started at the top of the right shoulder that we looked at in more detail on the daily chart above. I envision we are starting a similar impulse move down that will have some twist and turns along the way that will try to shake us off. The ride won’t be easy but if you can hang on you will experience a ride of a lifetime.
As you know personally I favour the maximum leveraged 3X bear ETFs in riding an impulse move . This is definitely not for everyone . The market can easily move against you 20% or more in one day . See Kamikazi Caution on the sidebar .
As I always tell Sir Fullgoldcrown . Find a Vehicle and Position Size you can live with for months and ride it for all its worth . Unfortunately with PM Stocks you are limited to 3X or 2X short etfs .
Only you , know your max pain tolerance
This last chart for the HUI shows the exact same setup as the last two charts above only this time it takes in the bull market years so you can compare our current setup to the bull market triangles. Our current blue triangle is very similar in time and price to some of the blue triangles that formed during the bull market. This is how markets move. For the more experienced trades out there you’re more than welcome to trade the little squiggles but for the average investor, get positioned and stay put until the impulse move runs it’s course. This is how you make the big bucks. Find an impulse move an ride it for all its worth.
I saved a bunch of monthly PM charts last night that I will show you tomorrow as I’m out of time tonight. You will be amazed at some of the percentage losses many of the big cap PM stocks made during the month of September. September was a good month for us in the Kamikaze Portfolio but this is only the very beginning of this impulse move. If you can fasten your seat belt and hold on for dear life, when the going gets tough, you will come out on the other side with a high cash reserve and the experience of actually riding and understanding what an impulse move is and how they work. That experience alone will be worth more than the profits you’ll make as you can take what you’ve learned and use it the next time you see an impulse move beginning. All the best…Rambus