On days like today I always like to look at the longer term charts to see if there was any damage done. Things can change real fast in the micro world but in the macro world it takes time to change the big picture.
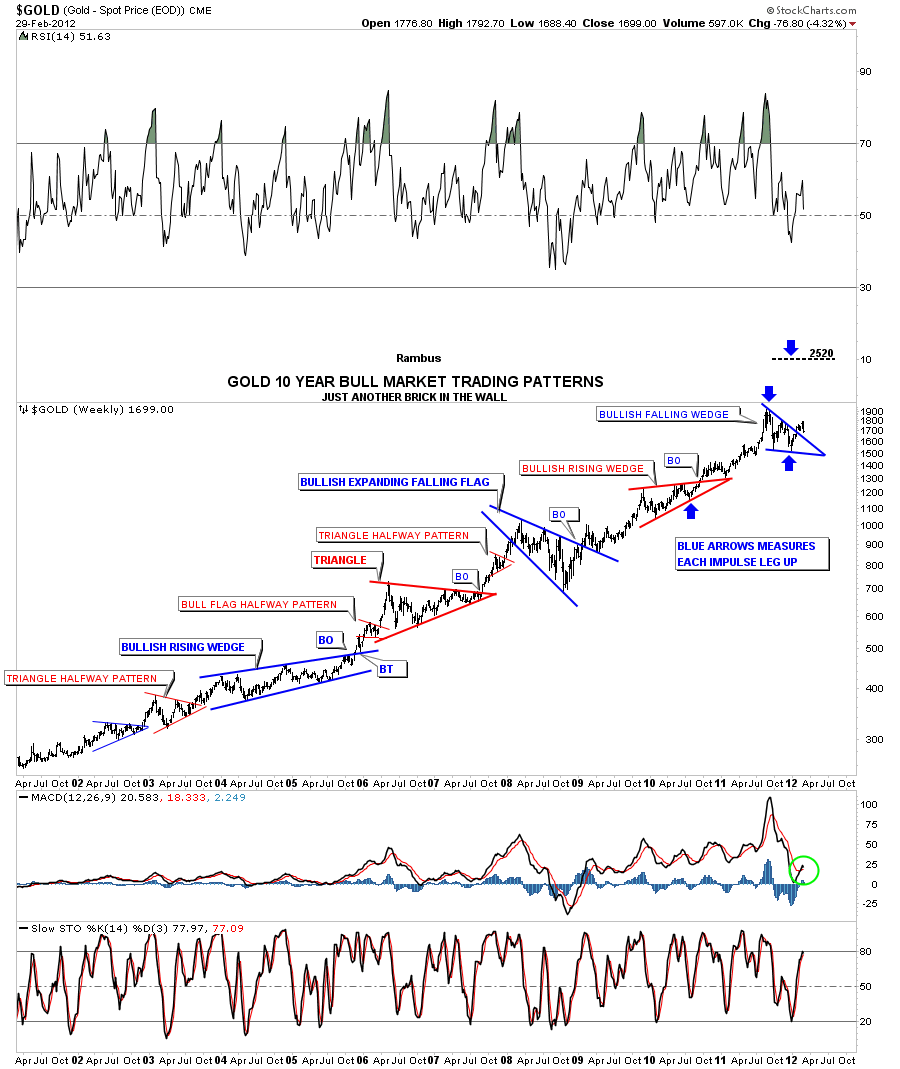
The first chart I would like to show is an 11 year chart of gold that I call “Just another brick in the wall” as this chart has all the consolidation patterns from the very beginning of the bull market. You can see the last pattern on the chart is our bullish falling wedge that fits nicely within the major uptrend. Can this pattern morph into a bigger consolidation pattern? Yes, but it will still be a consolation pattern. And its still possible that we can have another backtest to the top blue rail. But first thing first. We just have to see how gold reacts tomorrow and next week to really get a feel if this was just a one day event.
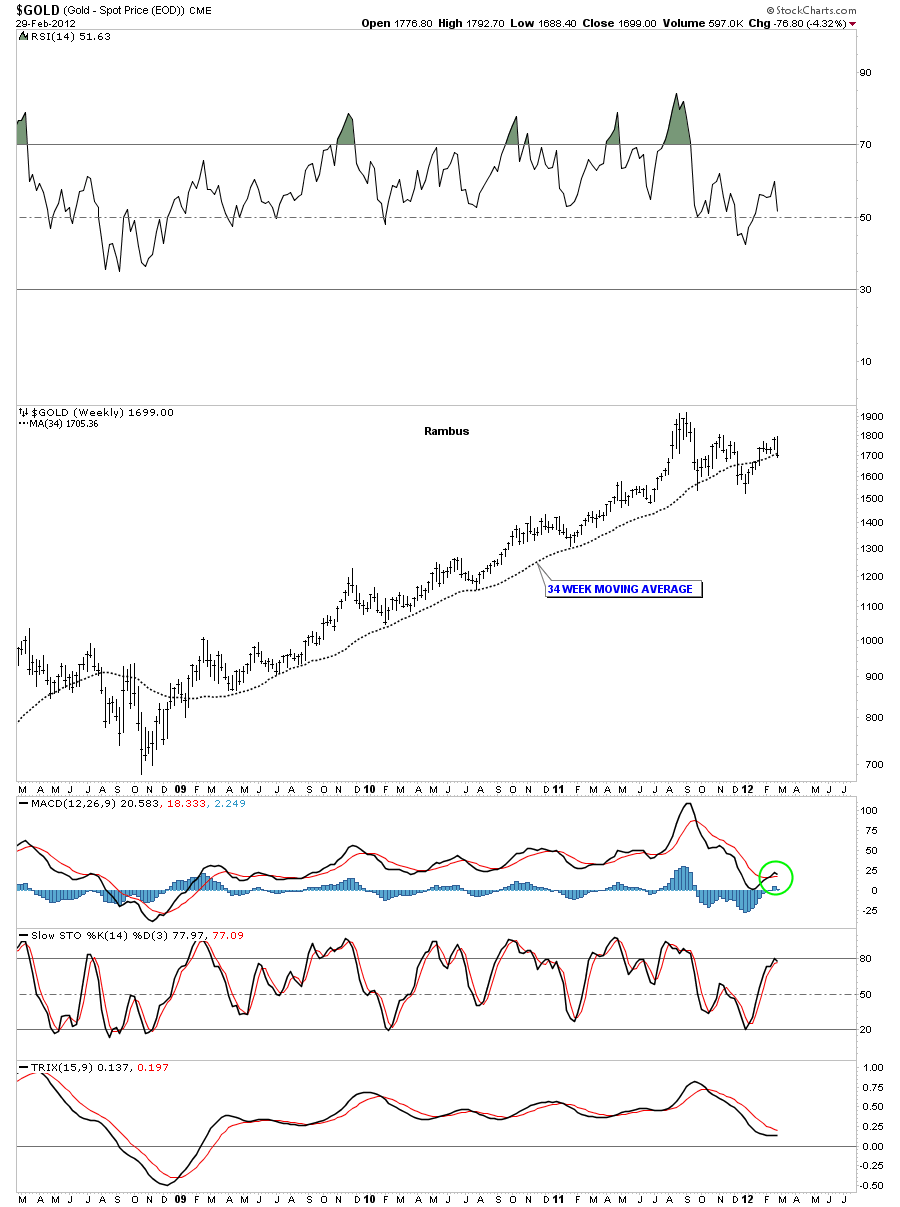
Below is a weekly chart with just a simple 34 wma with no patterns. It has a done a good job of calling the bottoms except when the correction was bigger than normal. Today’s price action stopped dead on the 34 wma.
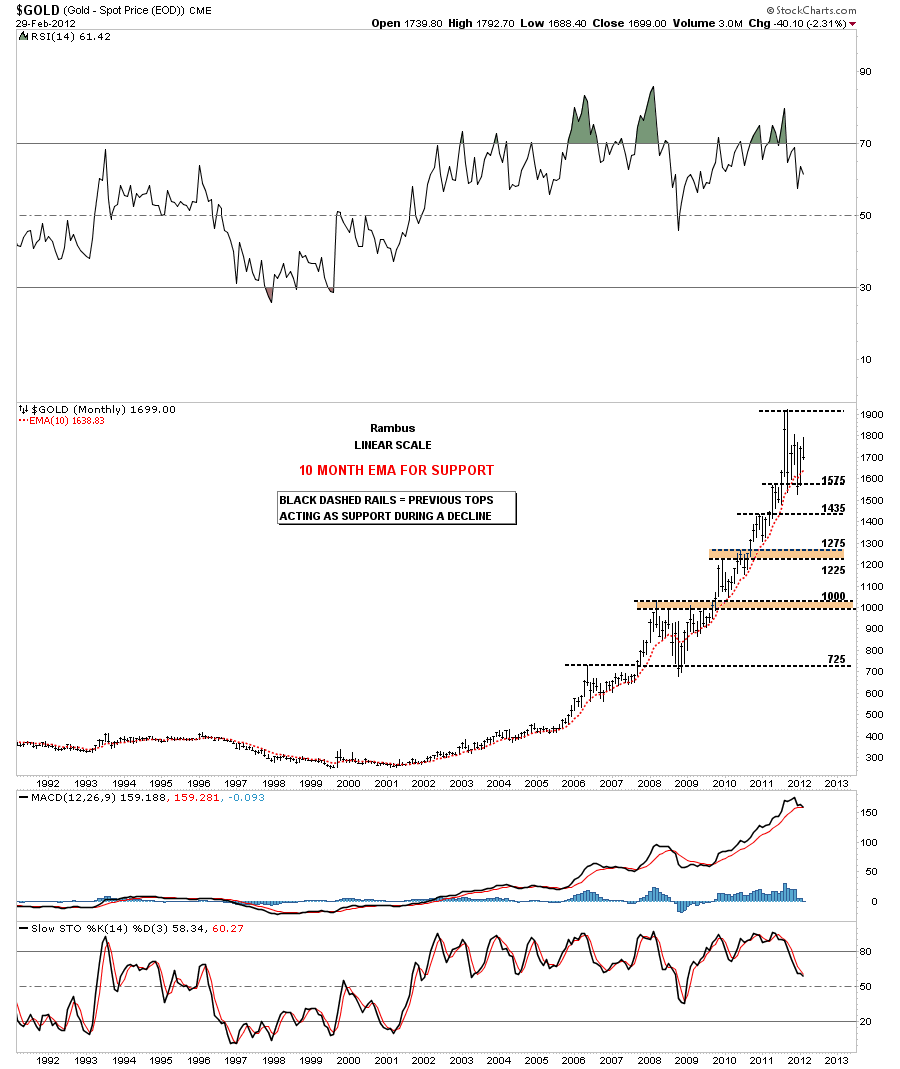
The last chart I want to show you is a 20 year look using the 10 month ema for support. You can see this moving average does a real good job of holding support. The only 2 case where gold closed below the moving average was in 2008 and our most recent low that quickly recovered after hitting horizontal support at 1575.
I think as this bull market in gold goes higher and higher, what we seen today, will become more of a normal occurrence. Today was a good test of our ability to withstand the steep shakeouts that will be coming down the road. As an investor, in one of the greatest bull markets of our time, riding the bull will become harder and harder the higher it goes. So put today’s action in the back of your mind and remember it the next time we get a good shakeout move. All the best…Rambus


