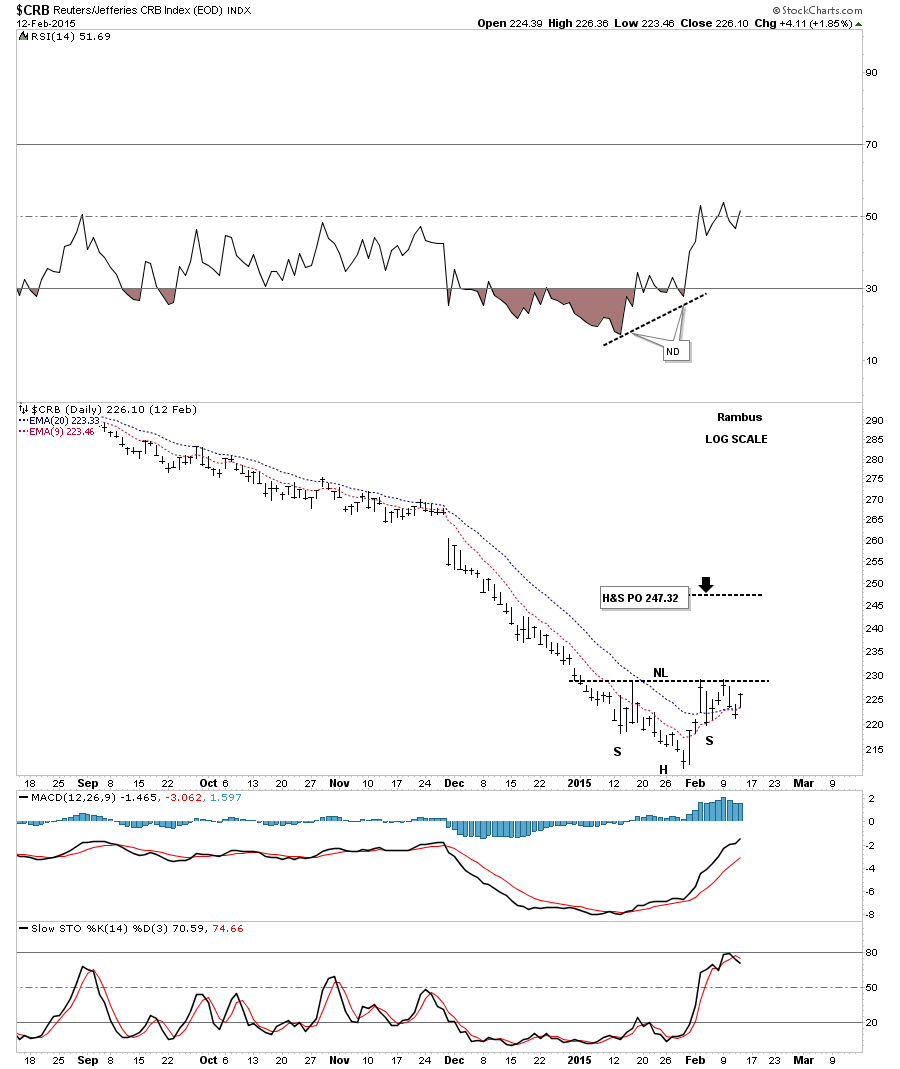
There seems to be something happening in the commodities complex over the last 2 weeks or so. I’m starting to see many small inverse H&S bottoms forming in some of the different commodities. Below is a daily chart for the CRB index that doesn’t show today’s price action on it until the end of the day. As you can see the right shoulder is just about finished building out and with the strong showing in most commodities there is a good chance the neckline maybe tested today.
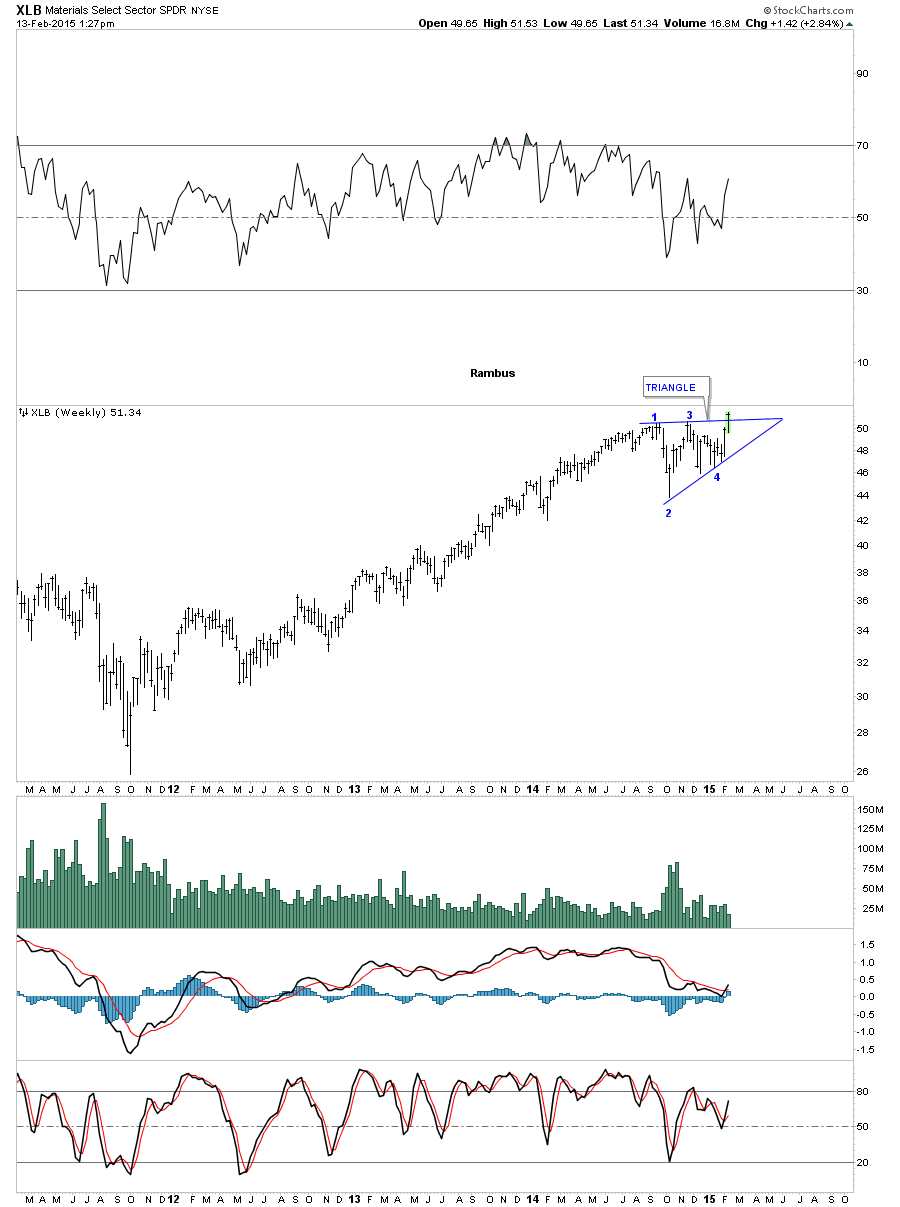
Yesterday I showed you this weekly chart for the XLB, basic materials index, that shows a big triangle that is breaking out.
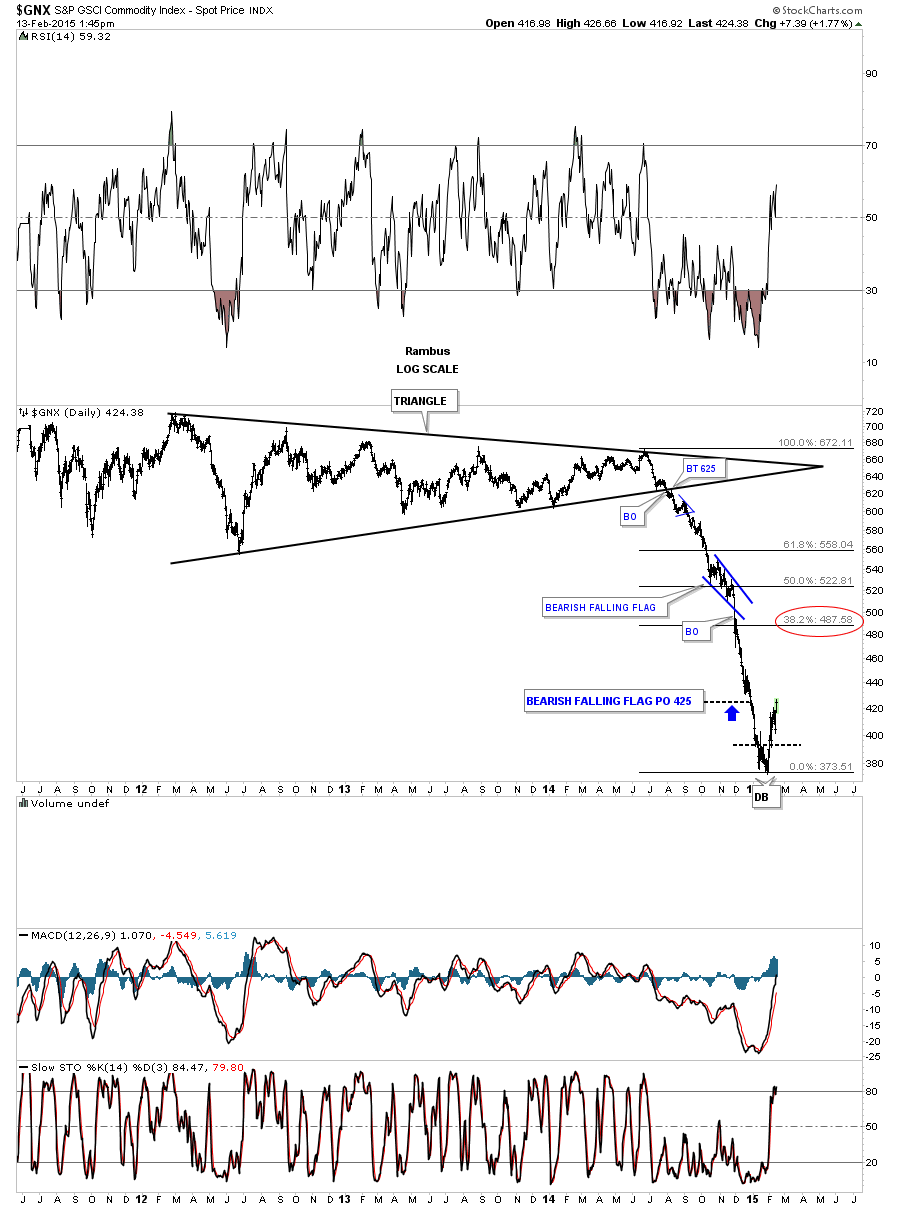
Below is a daily chart for GNX which shows it’s making a series of higher highs and higher lows for the first time in a long while.
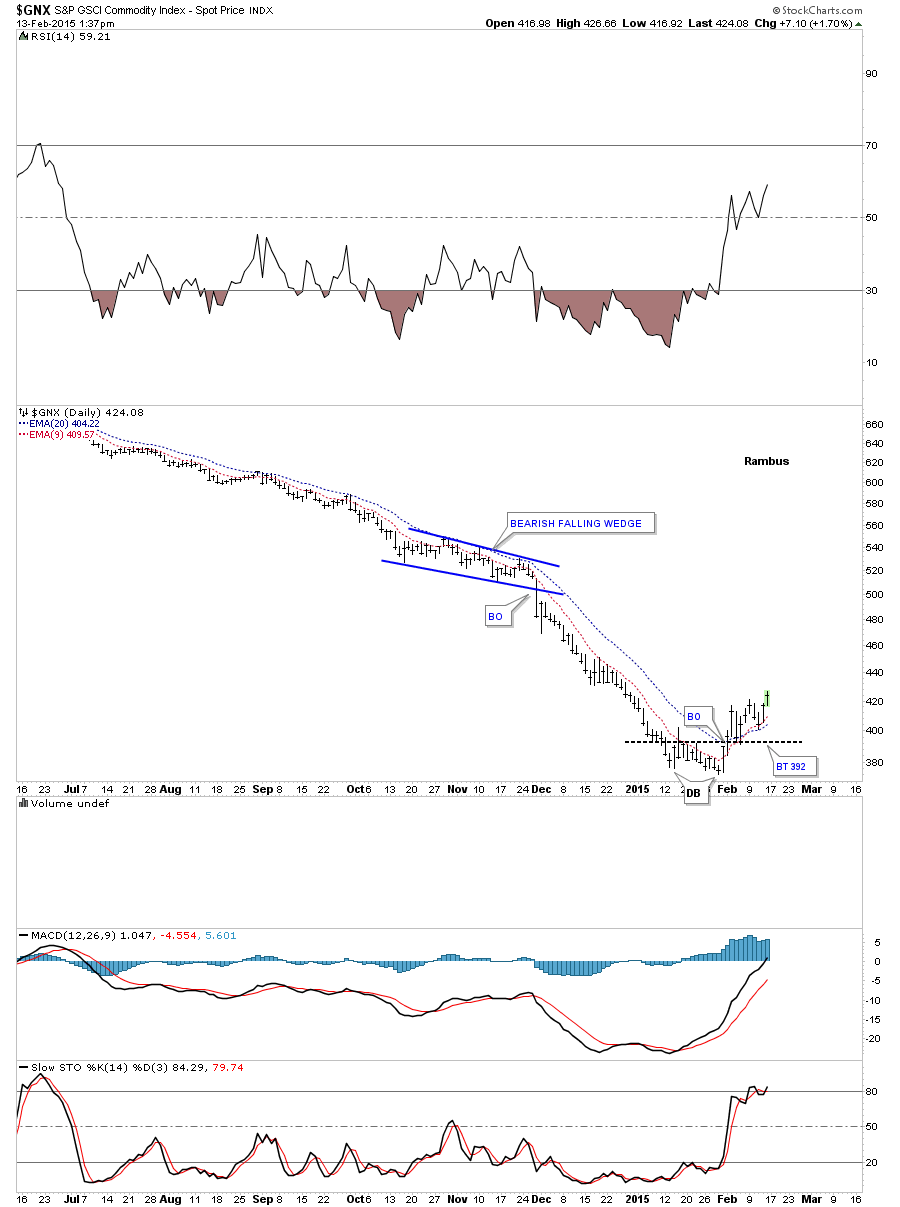
The next chart for the GNX is a long term daily look that shows the big multi year triangle that led to our most recent low once the bottom rail was broken to the downside. Remember that little blue bearish falling flag we looked at when it was building out? At this point I’m viewing this potential counter trend rally in commodities as a bear market rally. After a waterfall decline like this a 38% retrace would be healthy to keep the bear market alive in commodities
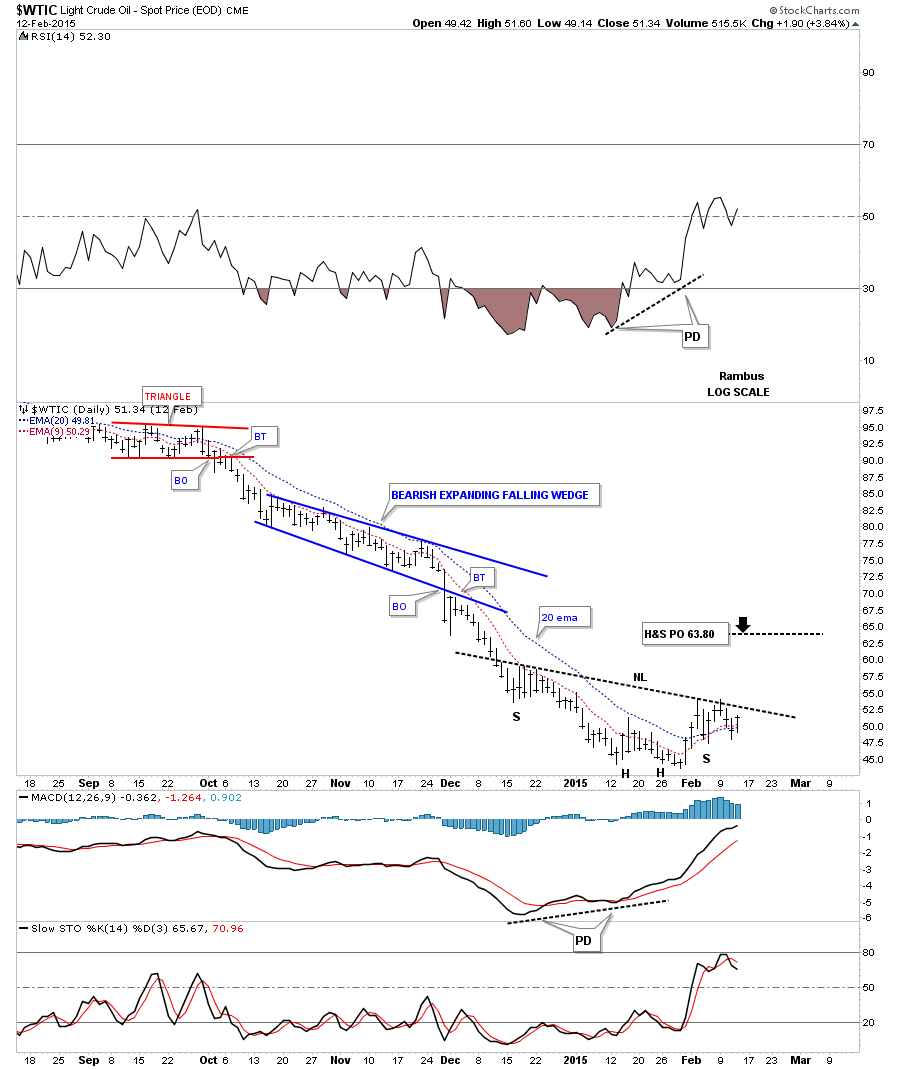
Below is a daily chart for oil we’ve been following that shows a possible inverse H&S bottom without today’s price action on this chart. If oil holds its gains from today the neckline should be coming into play.
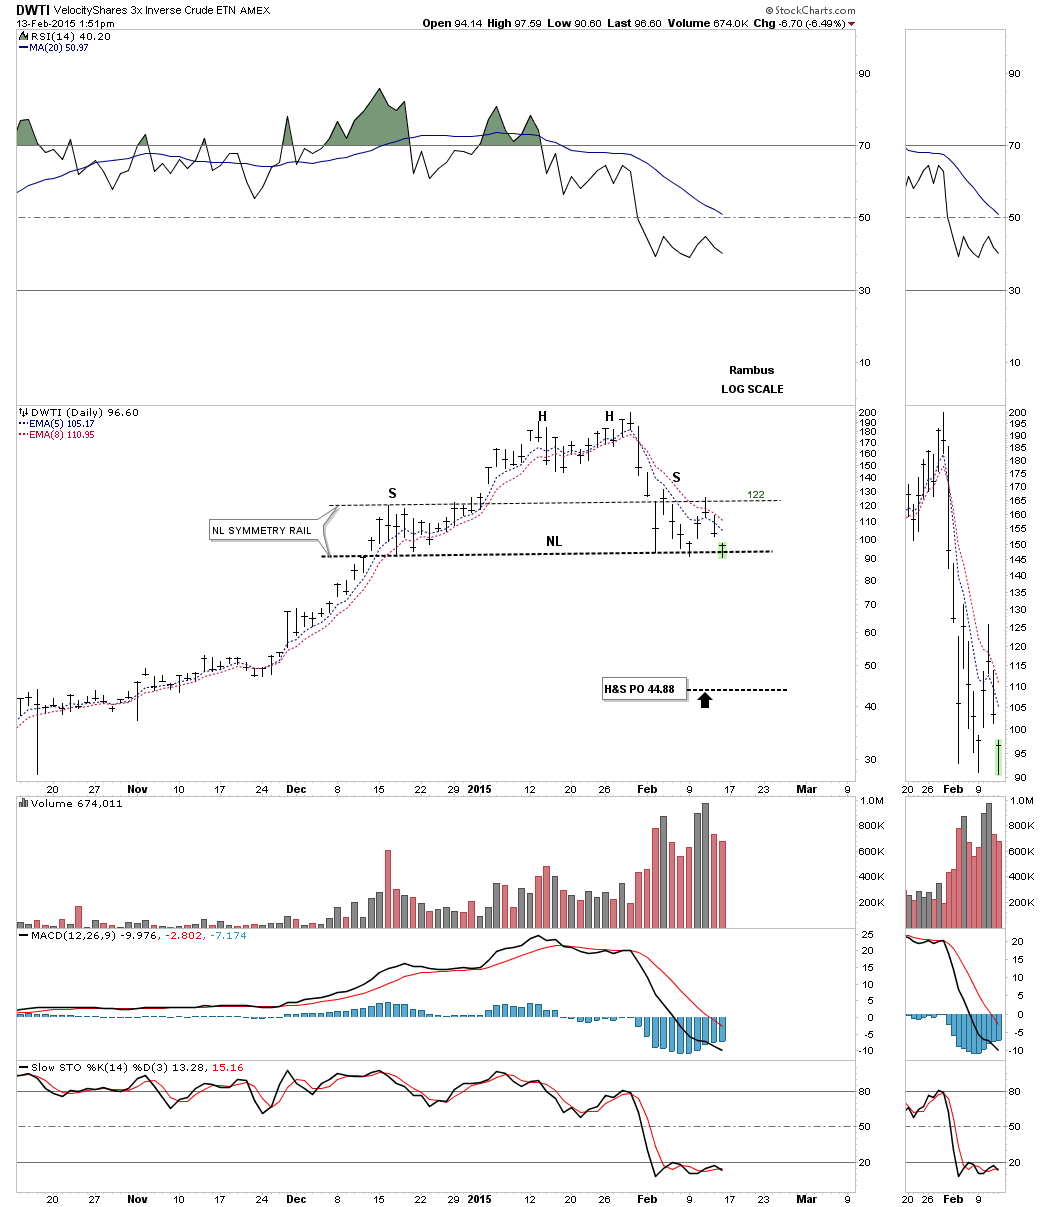
This daily chart for DWTI which is a 3 X short oil etf shows a very large H&S top which is testing the neckline today.
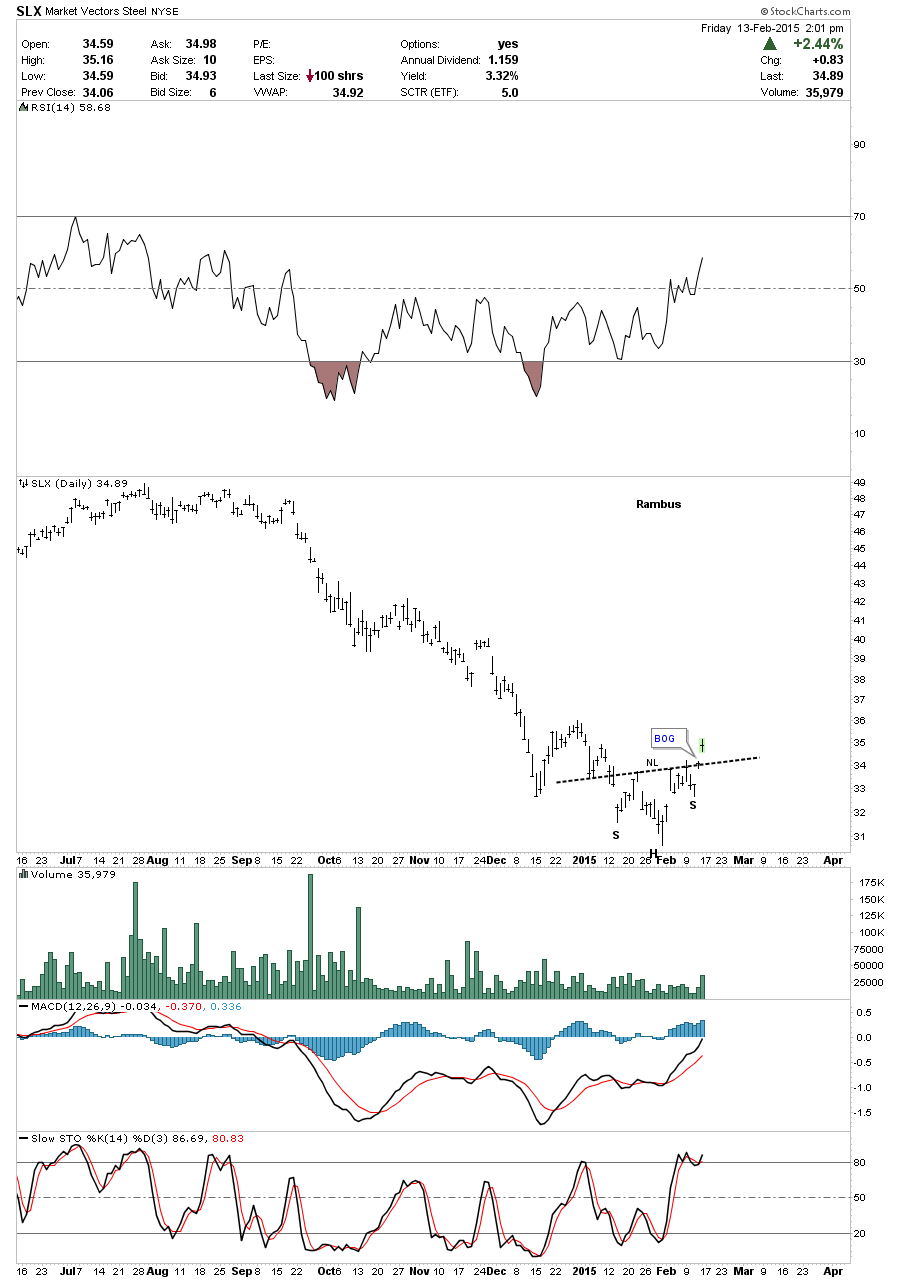
The daily chart for SLX which is a steel etf looks like it broke out of an inverse H&S bottom today. I’m going to look at some of the basic materials stocks in more depth in the Weekend Report. This area of the markets may need a breather before heading lower.