Last week was one of those weeks that we can label as an inflection point. By that I mean we broke below some critical support rails on the daily bar and line charts of the HUI. The HUI hit an 18 month low that goes all the way back to August of 2010. Maybe it was just a false breakout or maybe not. Its going to take alittle more time to actually confirm that the top is in but its now in the bull’s camp to to show it’s in control. The bears have already moved the HUI to an 18 month low showing they are in charge for the time being. I still think last weeks action is a big deal and not to be overlooked lightly. I’ll will try and show some charts that may point to lower prices once the breakout and backtesting period is over.
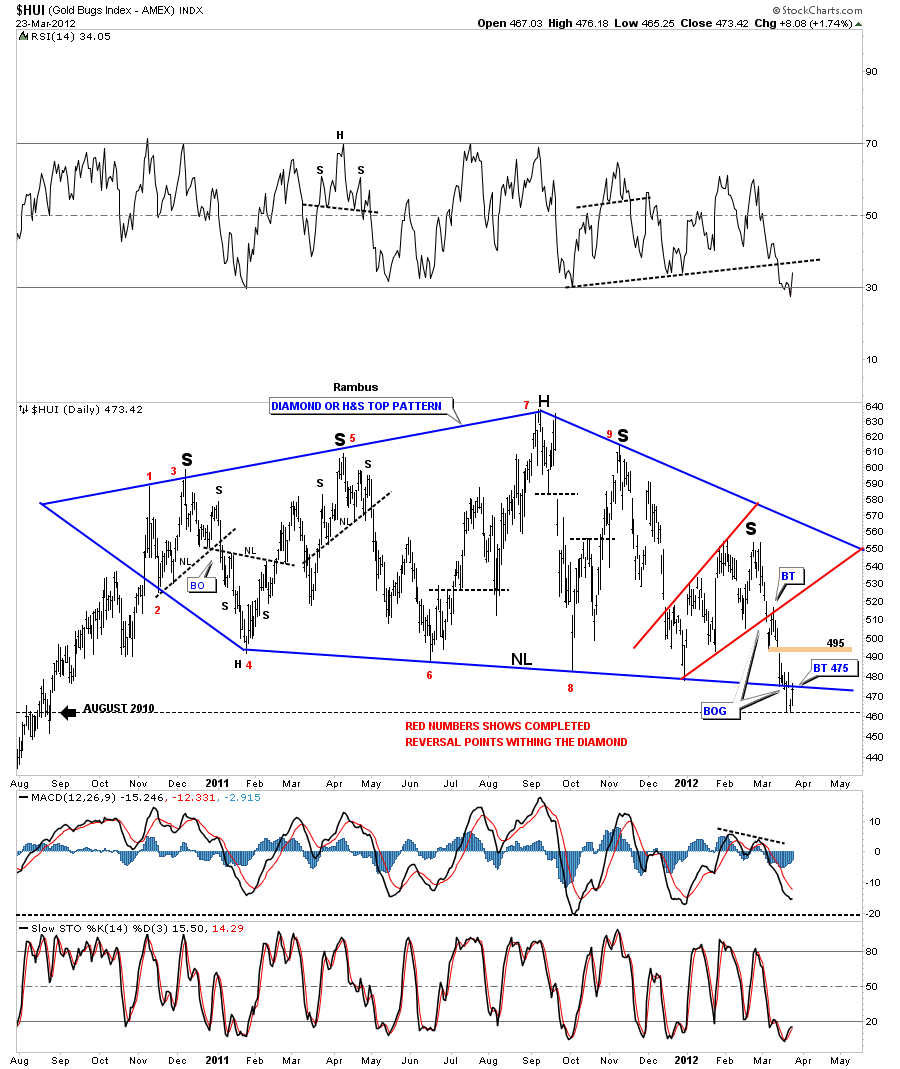
The first chart is the Diamond and H&S combo chart where both patterns are one of the same. You can also add the expanding triangle to that chart as well. Call it what you will but the bottom blue rail is the most critically important rail on that chart below. There is a gap around the 495 area that hasn’t been filled yet. That gap area would be my best case scenario for the bulls if they can achieve it. The first resistance point is the backtest to the bottom blue rail that we hit in last Friday’s rally at 475.
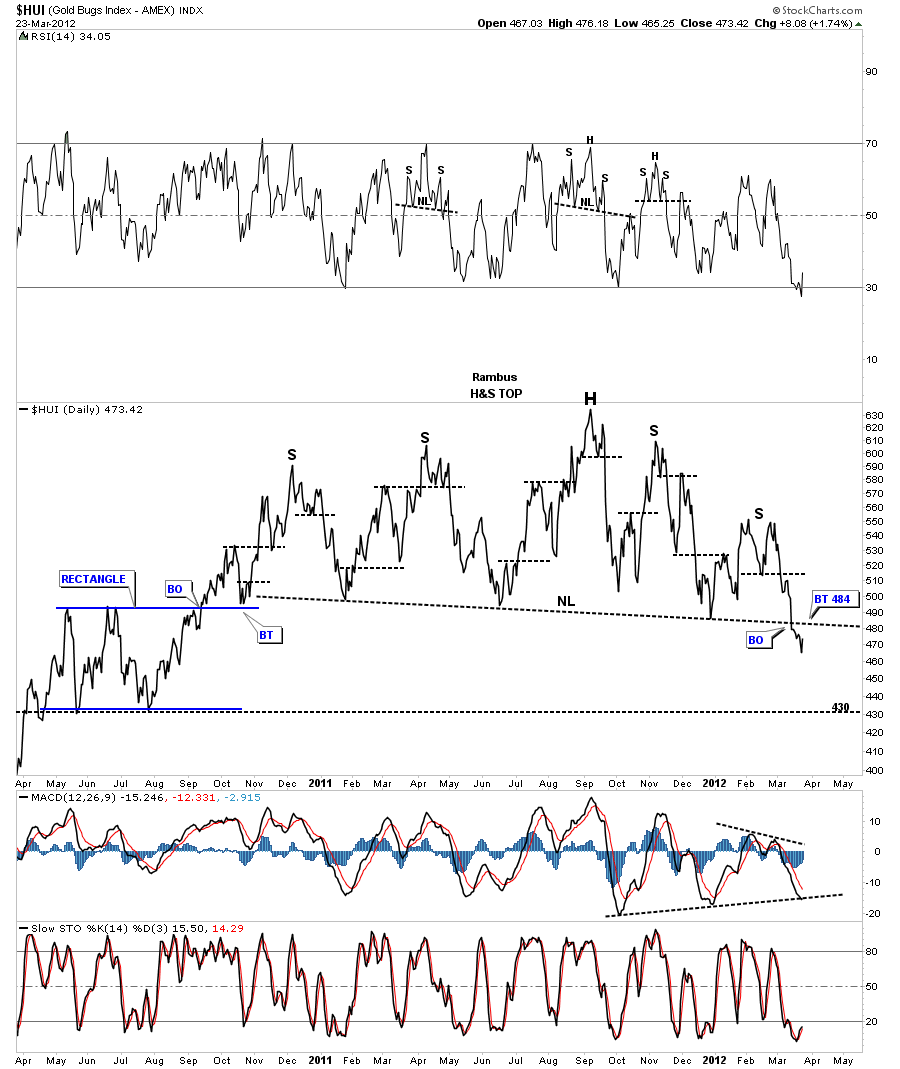
The next chart is a daily line chart that shows the H&S pattern pretty clearly. There are 2 left shoulders and 2 right shoulders with a nice head that is higher than both shoulders. A line chart generally shows the breakout alittle bit earlier than the bar chart will. As you can see the backtest to the neckline is at 484 which is about 10 points higher than the bar chart. If this H&S top patterns starts to play out to the downside, after the backtest takes place, the chart below shows where we may see our first counter trend rally off the 430 area that saw support back in 2010 at the bottom of the rectangle. The top of the rectangle is about 495 that I think has been offering support, allowing for the neckline to develop in a slightly declining manner. This weeks action finally broke through the top of the rectangle support and now the price action will target the bottom rail of the rectangle at 430 or so where we may get a counter trend rally all the way back up to the big neckline we are attempting to breakout of right now.
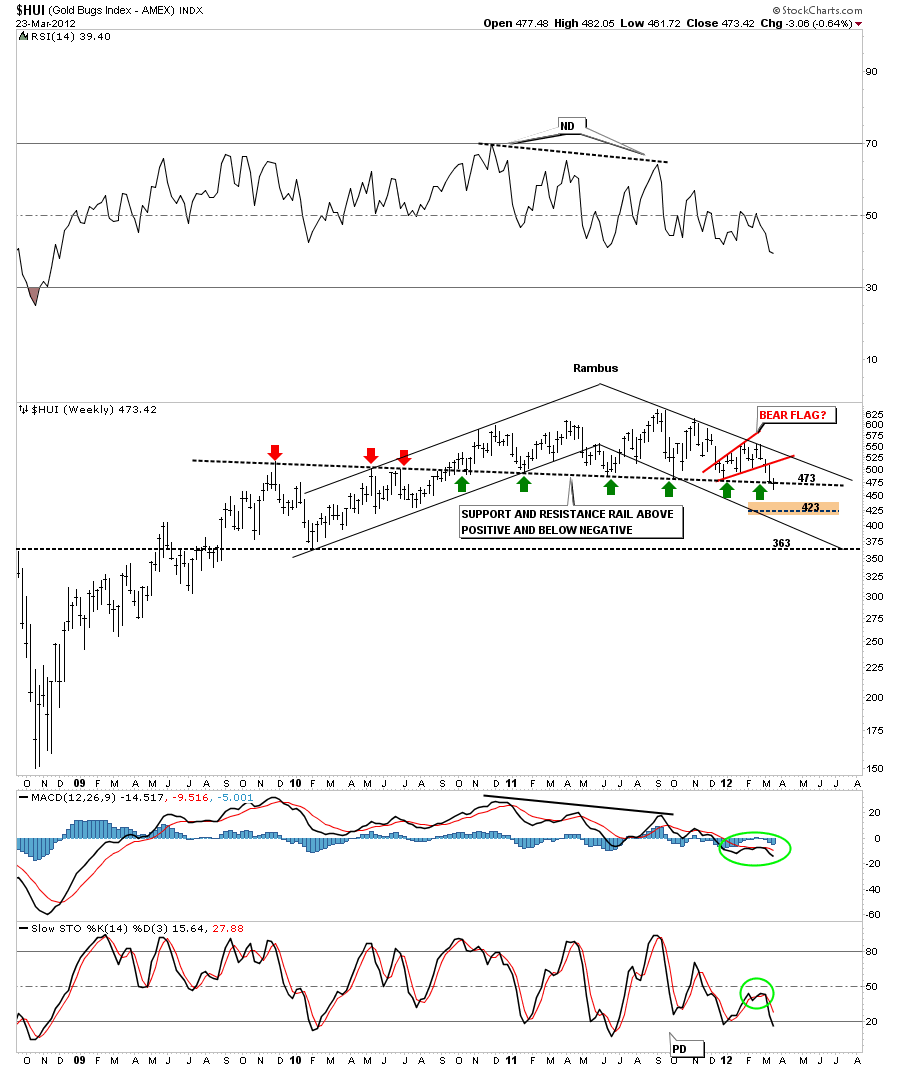
The next chart is a weekly bar chart that shows the HUI has been in a downtrend channel. Note the uptrend channel on the left side of the chart, higher highs and higher lows. Now look to the right side of the chart and the downtrend channel where the HUI has been making lower lows and lower highs. This is basic technical analysis.
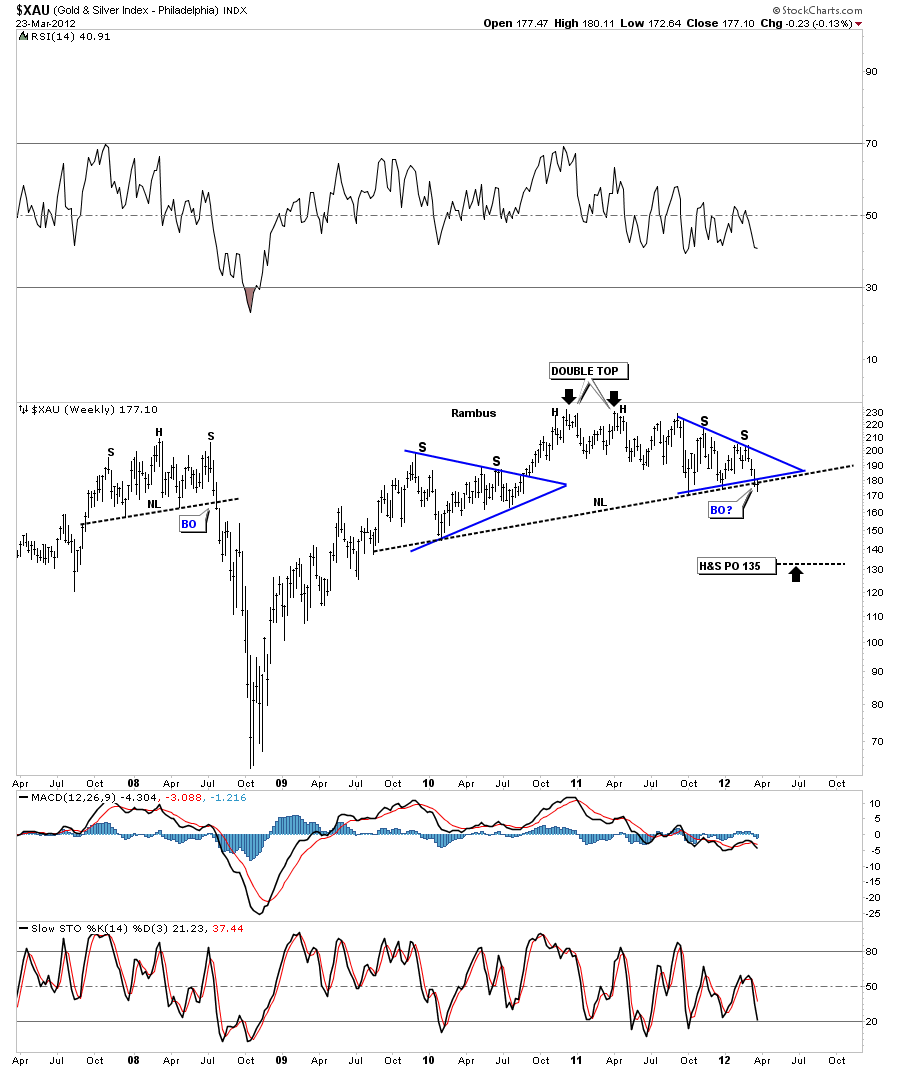
Lets see if the XAU has formed a H&S top. As you can see last weeks action took the XAU just below it’s neckline. We are still very early in the breakout process that may continue for several more weeks or so before we get total confirmation. Notice the H&S top on the left side of the chart. Some of you may remember the consequences of not believing that pattern when it took place. I have repeated several times in the past never ignore a potential H&S top. If it doesn’t workout you can always get back in but on the other hand if it does workout and you didn’t act accordingly then be prepared to suffer the consequences.
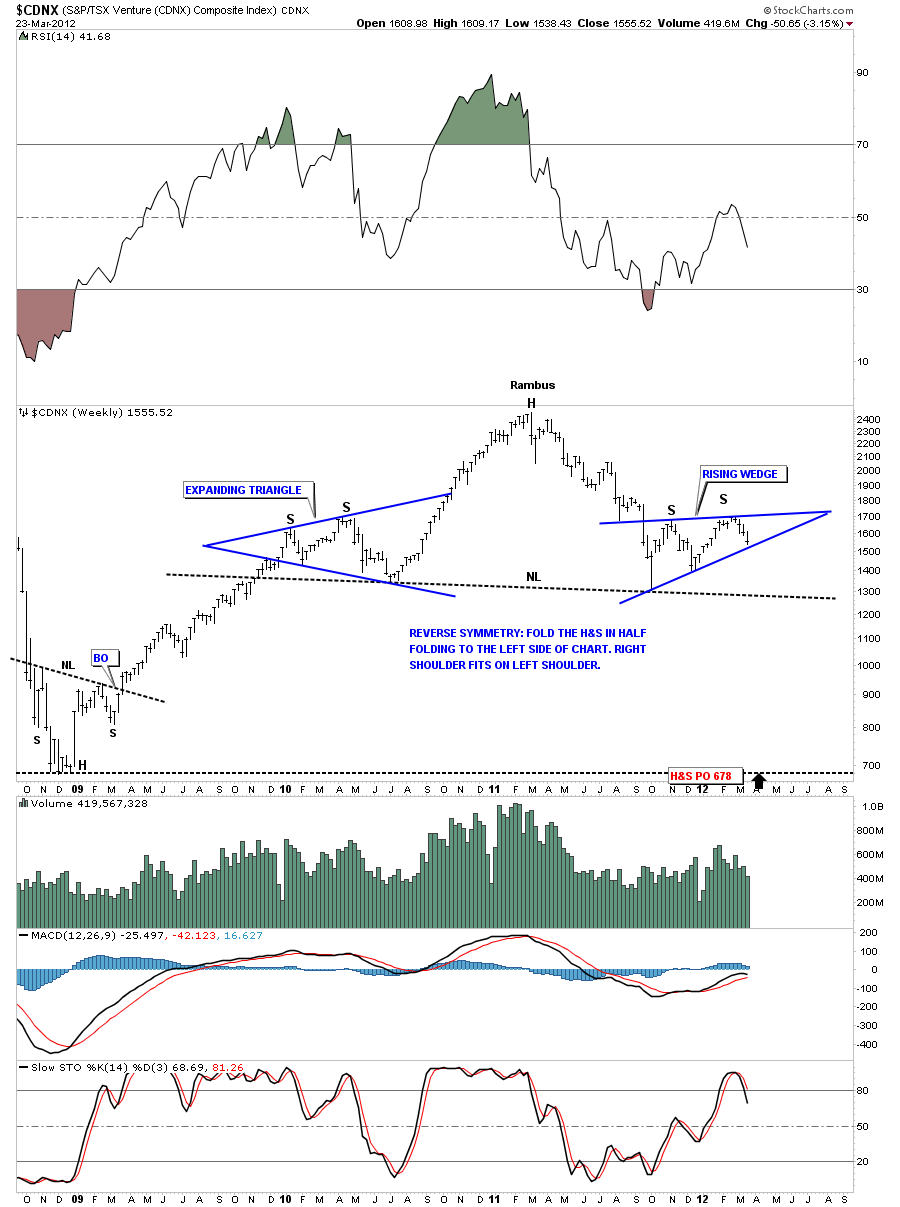
Lets look at another potential big H&S topping pattern that is still forming. The CDNX is a small cap Canadian index that has many small cap mining stocks along with some small cap oil stocks. Its a good proxy for the junior precious metals stocks. There is still some work to be done but the symmetry is pretty awesome.
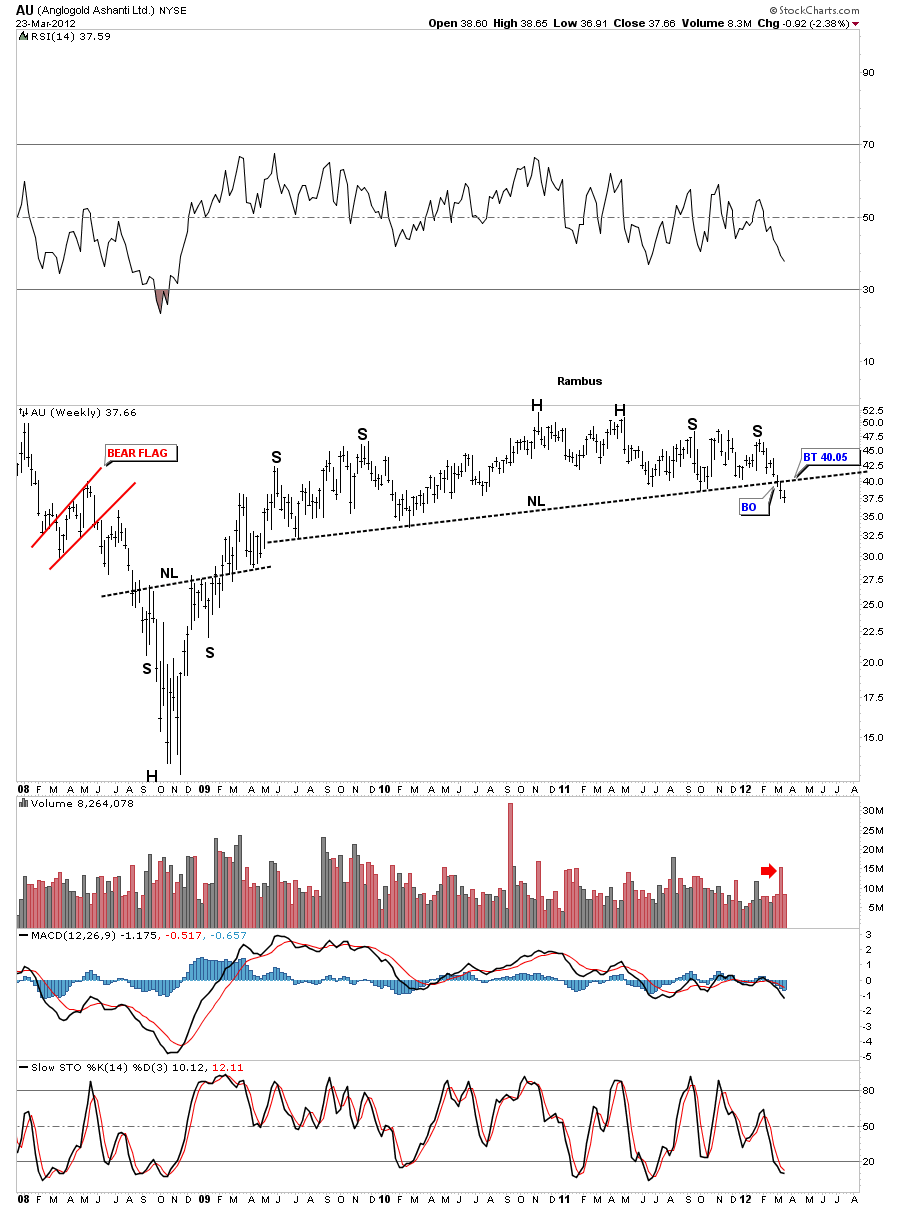
Lets look at some longer term H&S tops, in the precious metals stocks, that will show the same big neckline that is close to 18 months or so in the making. Some will already have broken the neckline, while some are still above their necklines.
AU has a very long neckline that broke to the downside two weeks ago. You can see there is a possible backtest to the 40 area to complete the breakout and backtest.
The monthly look really tightens up the H&S top pattern.
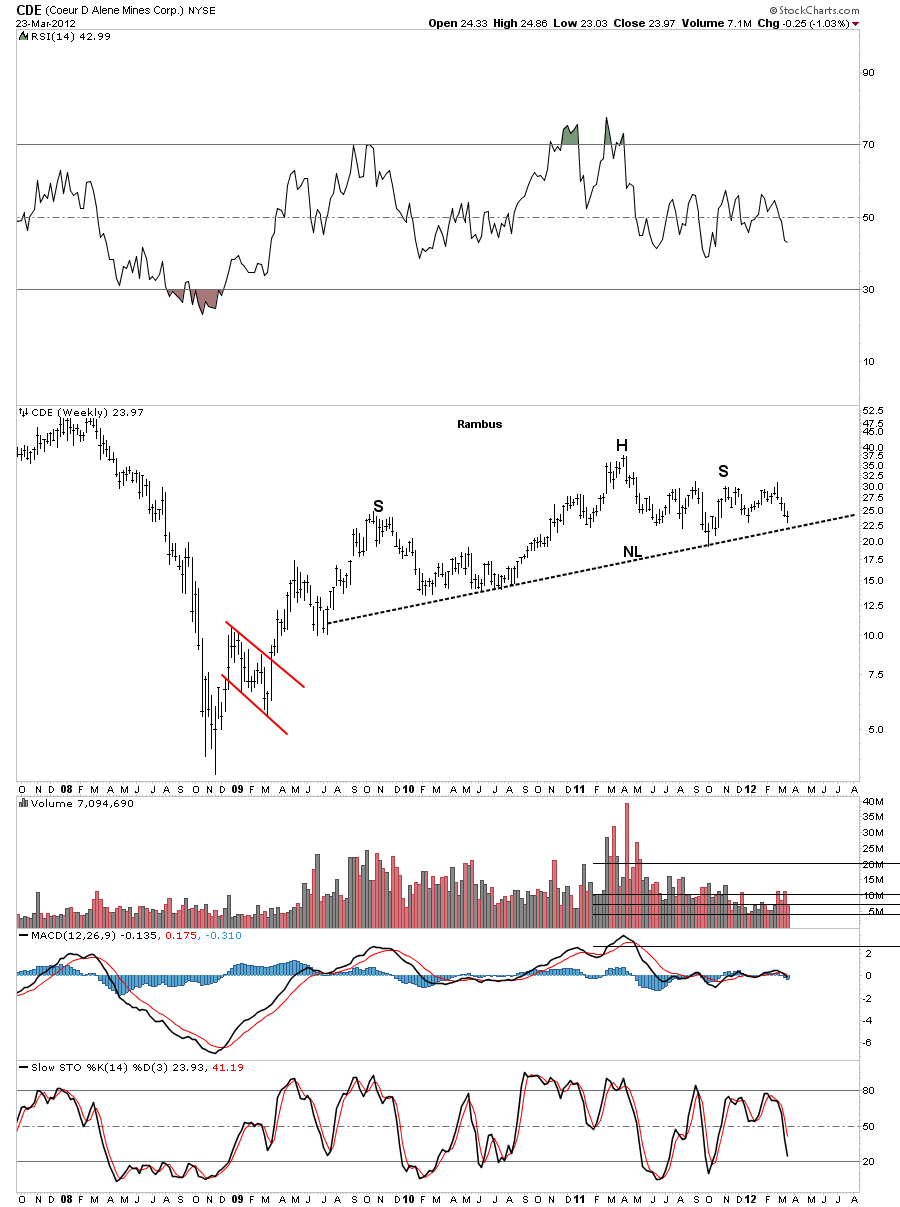
Next lets look at the potential H&S top for CDE which is still trading above the neckline.
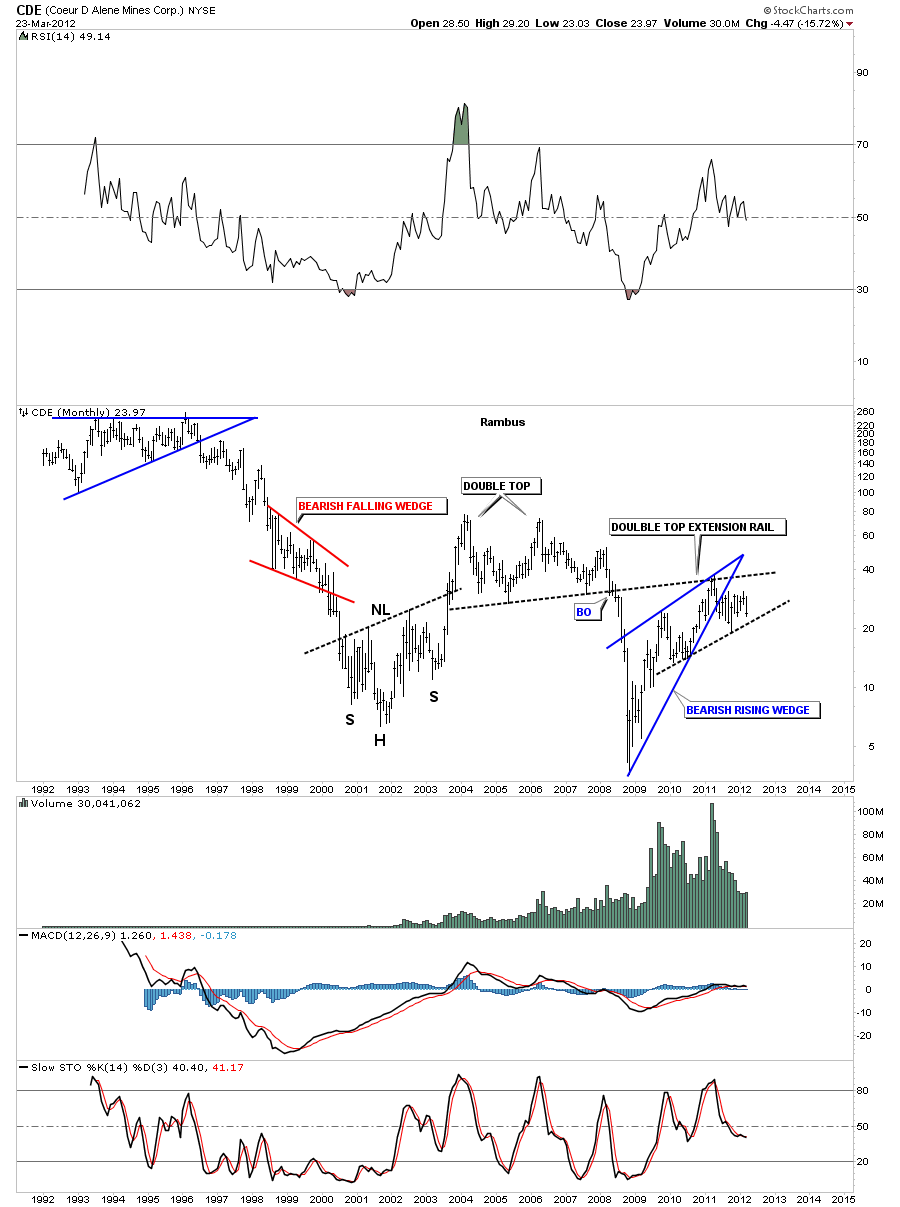
The monthly look shows how the double top extension rail acted as resistance on the rally phase off the 2008 bottom. There is also a bearish rising wedge in play.
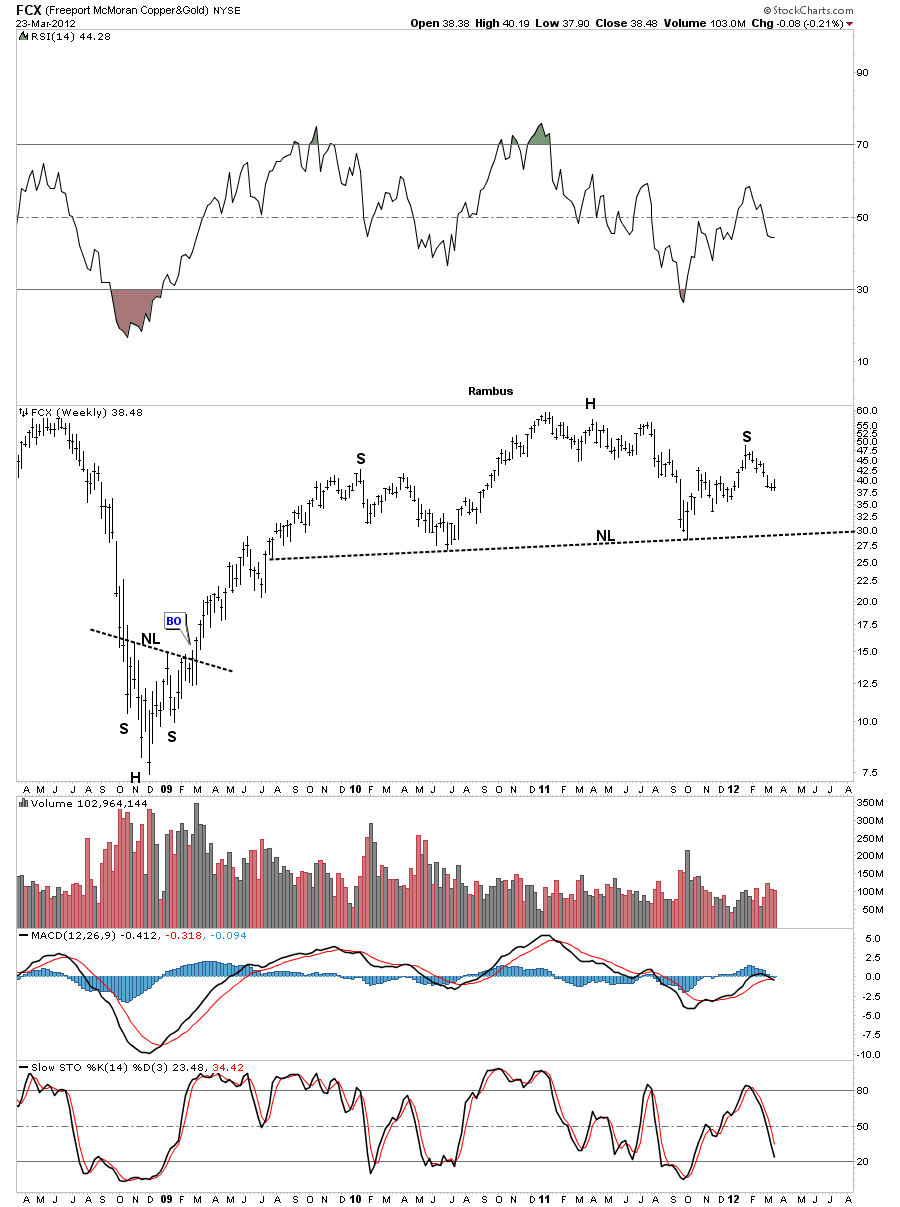
The next chart that has the big neckline is one of the star performers since the 2008 crash low. As you can see FCX is still quite a bit above it’s neckline but the symmetry is there to finish off the right shoulder.
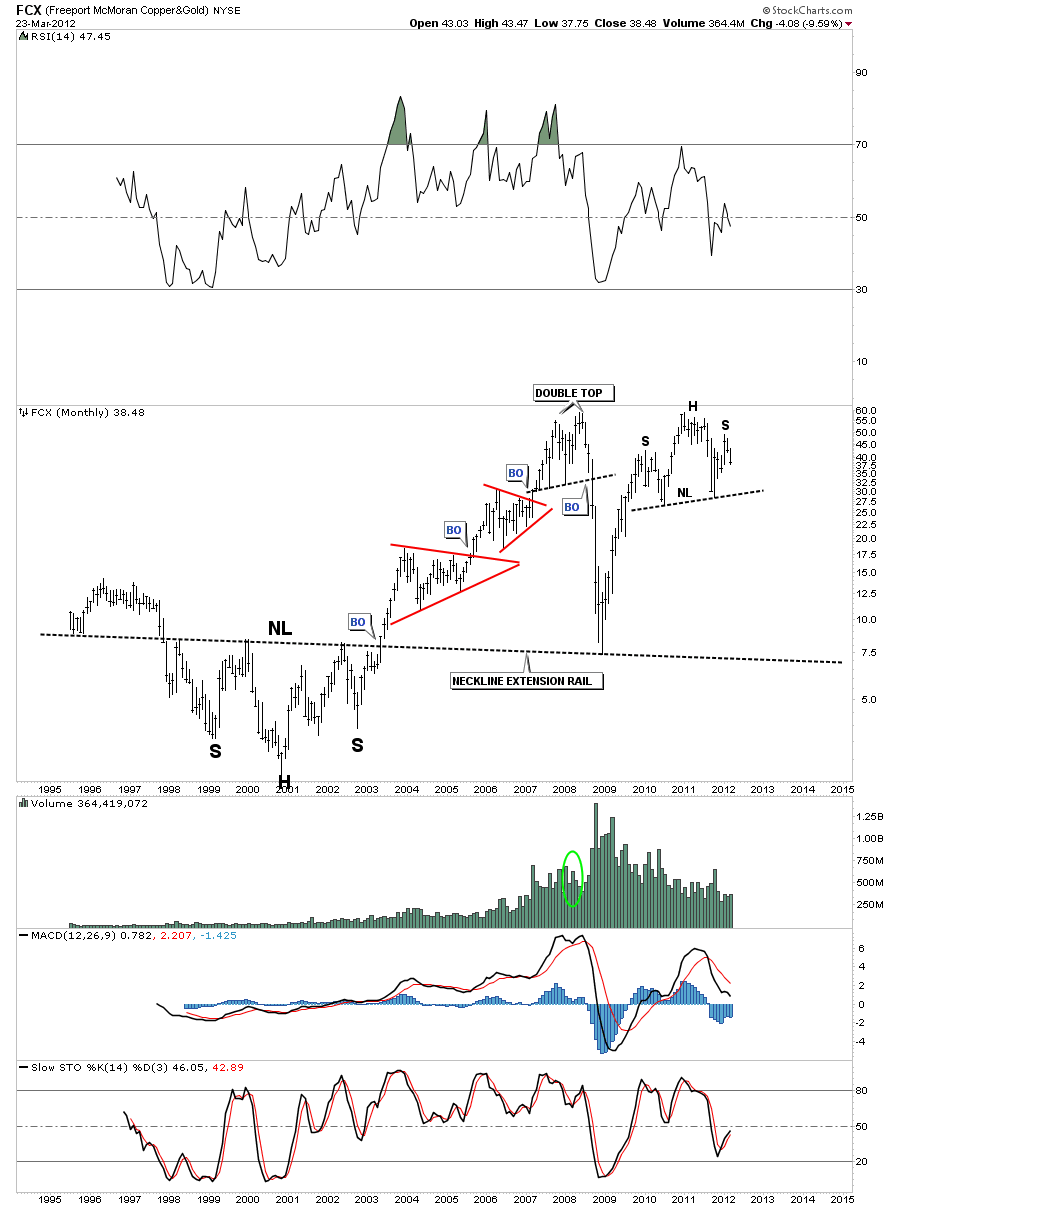
Lets tighten up that big H&S using the monthly chart. Note how the big H&S base, with the neckline extension rail that was made at the turn of the century, held support on the 2008 crash low.
SA shows the big neckline that it broke below 6 months ago and has just finished up another backtest.
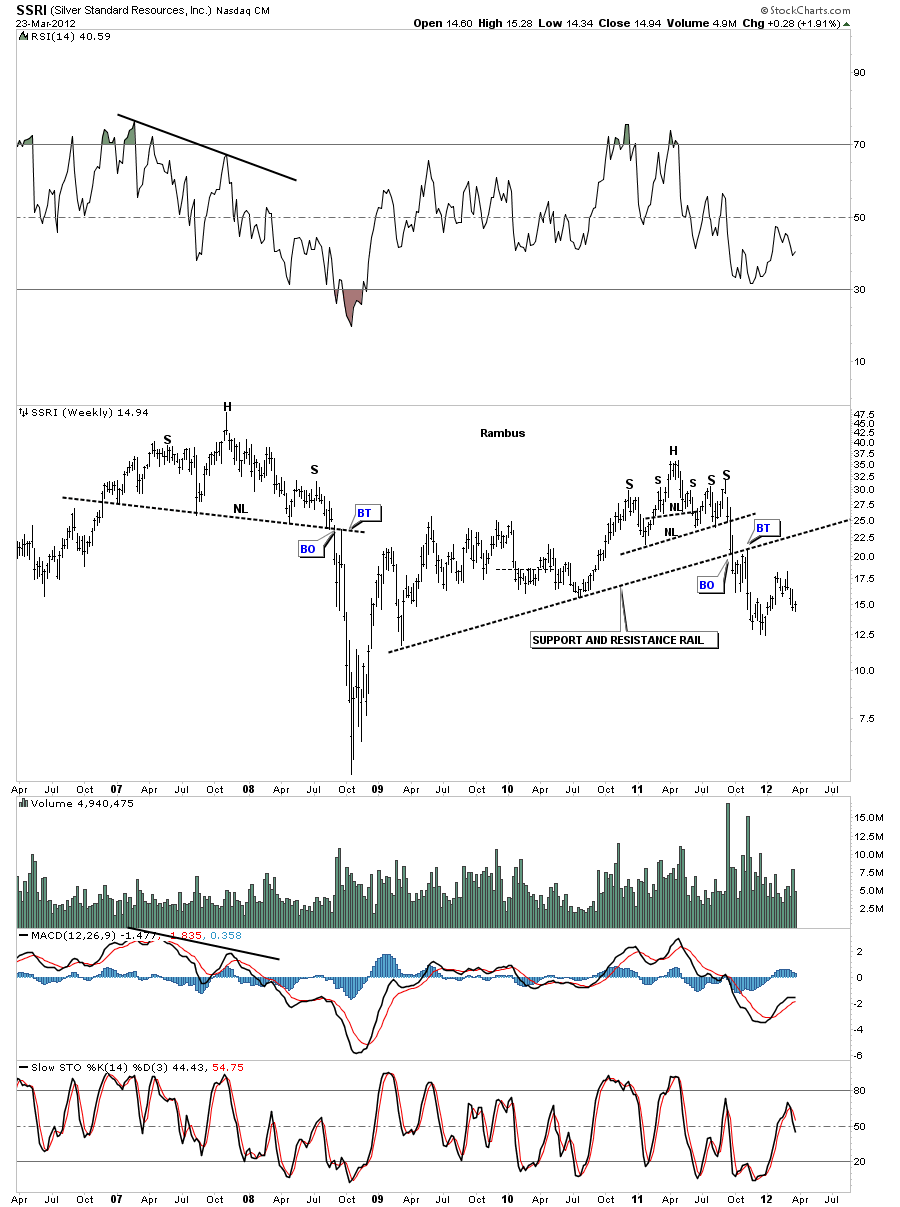
Lets look at one more chart with the big support and resistance rail. SSRI broke below it’s big S&R rail last year and had a nice backtest before it began to fall in earnest.
As you can see from the charts above that the big 18 month neckline is a key component in alot of precious metals stocks. Some have clearly broken below, some are getting close to breaking below and some are still above their neckline with a ways to go yet. As with any index most stocks don’t always break down at the same time. The weaker ones usually lead the way while the stronger ones will take their turn last. For alot of the precious metals stocks, that make up the indexes, there is still some work to do in regards to the breaking out and backtesting of their individual chart patterns. The bottom line is we can see the backtest taking place over the next several weeks before finally confirming the trend is now down instead of up or sideways as has been the case for the last 18 months or so with many of the big cap precious metals stocks. So we are at a major inflection point right here and now. Its up to the bulls to take the lead if the precious metals complex is going to rally to new highs. The burden of proof is now in their hands.

