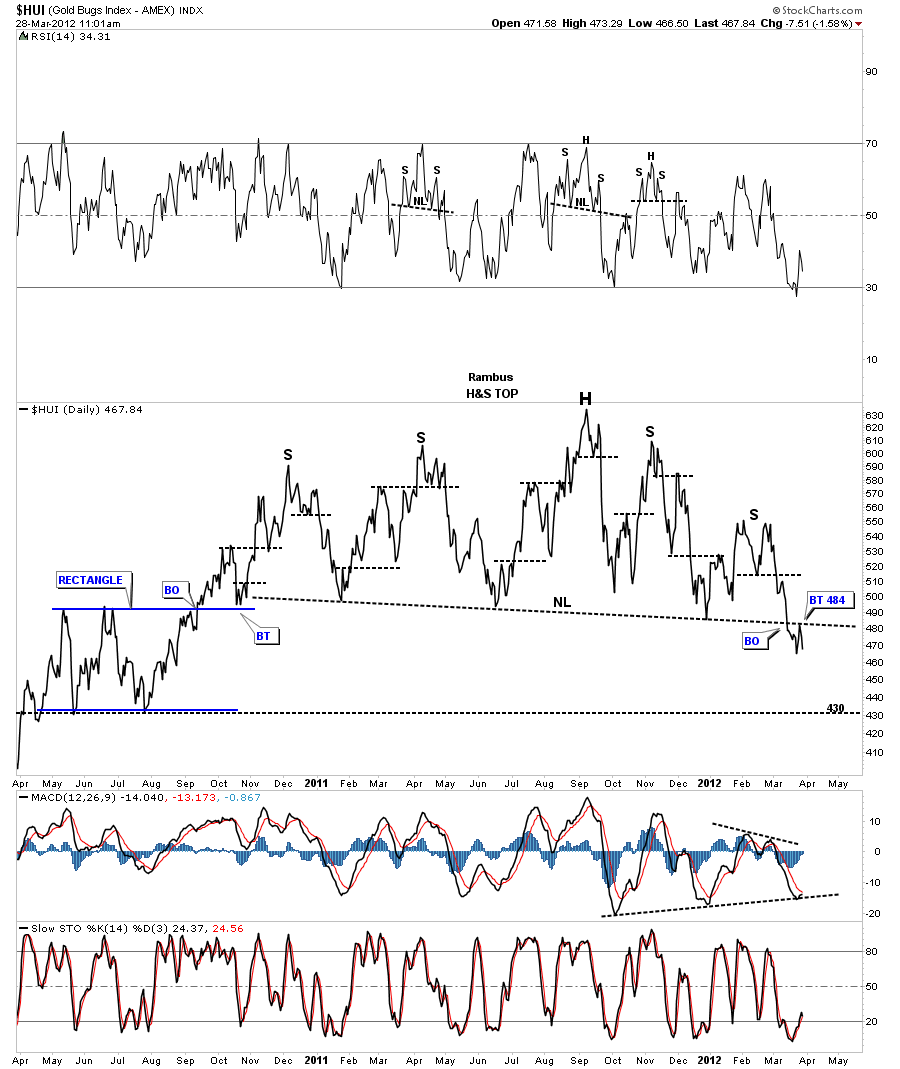
Below is the line chart that I’ve been showing that has the big H&S top in place. Remember a daily line chart takes the daily closing price only, added it to the previous days close, to build your chart. A line chart can takeout alot of noise that sometimes and can show a cleaner picture in some cases. As you can see on the chart below the HUI has had a clean backtest so far to the neckline at 484..I don’t want to sound like a broken record but that’s a very large H&S top that is complete. The further we fall below the neckline the big H&S top will start sticking out like a sore thumb. Its truly amazing to me that no one is seeing this massive topping pattern. I think everyone is so focused on the precious metals stocks, that have to go up, that they aren’t seeing the big picture. All I read is its time to buy because of all the bargains and how cheap the precious metals stocks are. As we all know they can get alot cheaper before the bottom is actually in. I have placed the next price objective down at 430 which was the bottom of the rectangle consolidation pattern made on the way up. It wouldn’t surprise me if we got a nice counter trend rally back up to the neckline and build out some symmetry on the right side of the chart equal to the left side once we reach 430.

