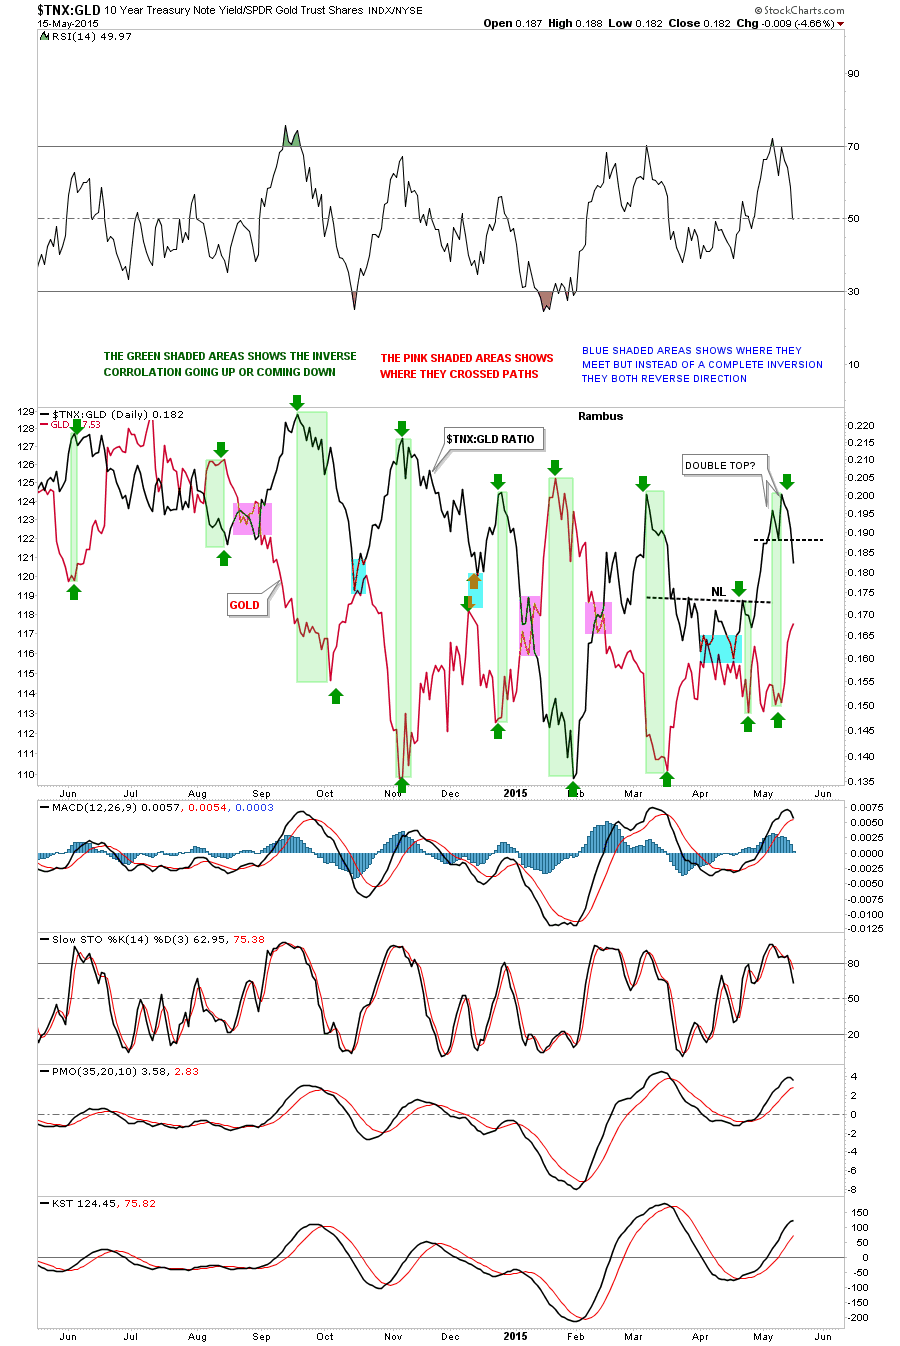
Below is a ratio chart we looked at a few weeks ago that compares the $TNX:GLD in black overlaid on top of GLD in red. This chart shows you the inverse correlation between the ratio and GLD. When the ratio in black is rising the GLD is generally falling and vice versa. If you look to the right hand side of the chart you can see the ratio, in black, just put in a double top and is starting to decline while GLD in red is now rising giving us the inverse look. The green shaded areas shows the complete inversion of the two where one tops out while the other bottoms out. The pink shaded areas shows where the two crossed paths on their way to a complete inversion. The blue shaded areas shows where the two started to do a complete inversion but stopped short when they met in the middle and then reversed direction. That brings us up to our current situation which shows the black ratio topping out with a double top and GLD bottoming on the last green shaded area on the right hand side of the chart. Now the question becomes will the two just touch somewhere in the middle of the chart and then reverse direction, blue shaded areas or will we get a complete inversion where they both will transverse the chart from top to bottom. With the double top in place on the black ratio chart it looks like the GLD is going to have a chance at a rally phase. How big GLD’s rally will be will depends on what happens when they meet in the middle of the chart. If they do a complete inversion then GLD should have a pretty decent rally on its hands. If they both touch in the middle and then reverse direction then GLD’s rally will be fairly short lived.
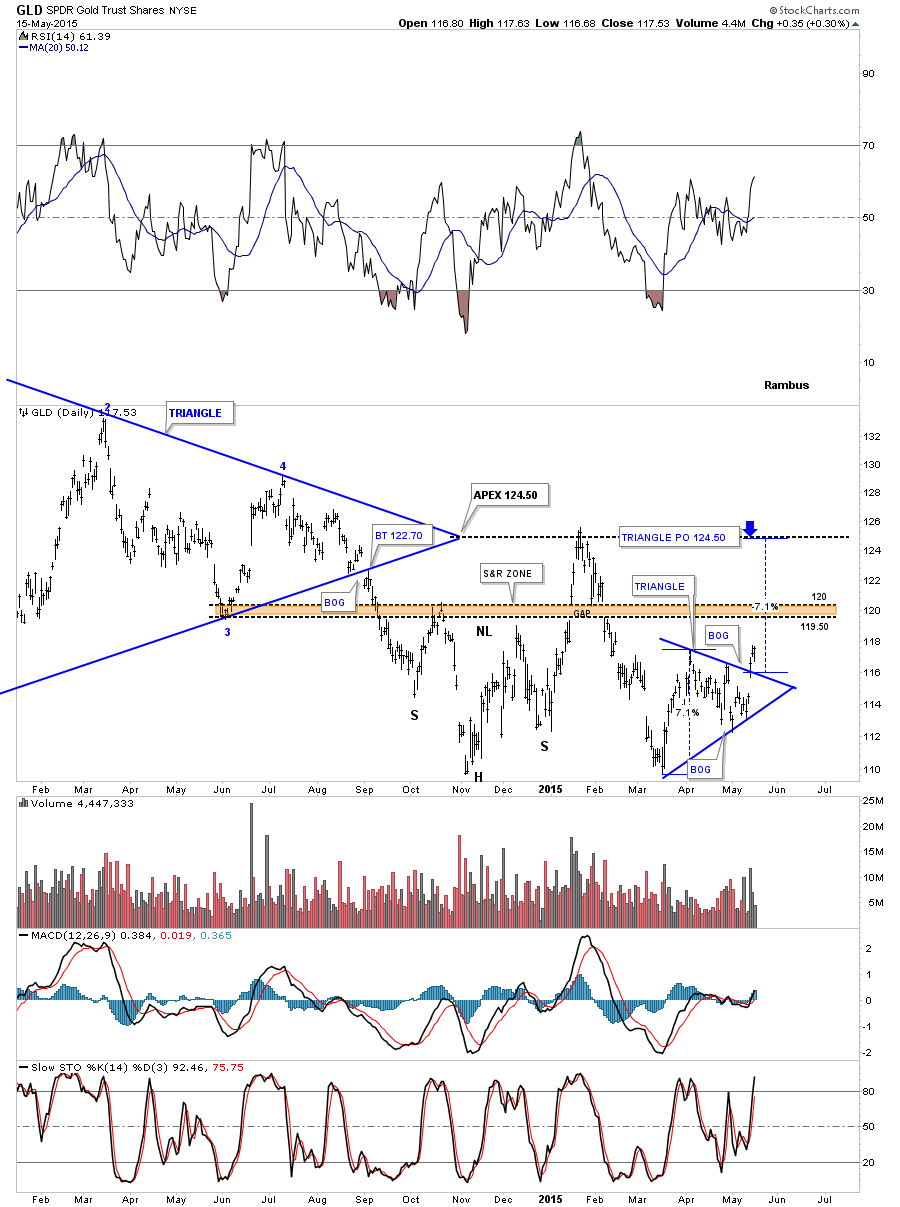
There is a daily chart for GLD that I’ve not shown you yet that is a blue 5 point triangle reversal pattern that has formed at our most recent low in March.To get a price objective in a situation like this I take the measurement form the width of the blue triangle and add it to te breakout point of the blue triangle to get a measured move price objective. This would give gold a price objective up to the 124.50 area at the previous high and the apex of the big blue triangle. I will show you on the following chart why the 124.50 area is important.
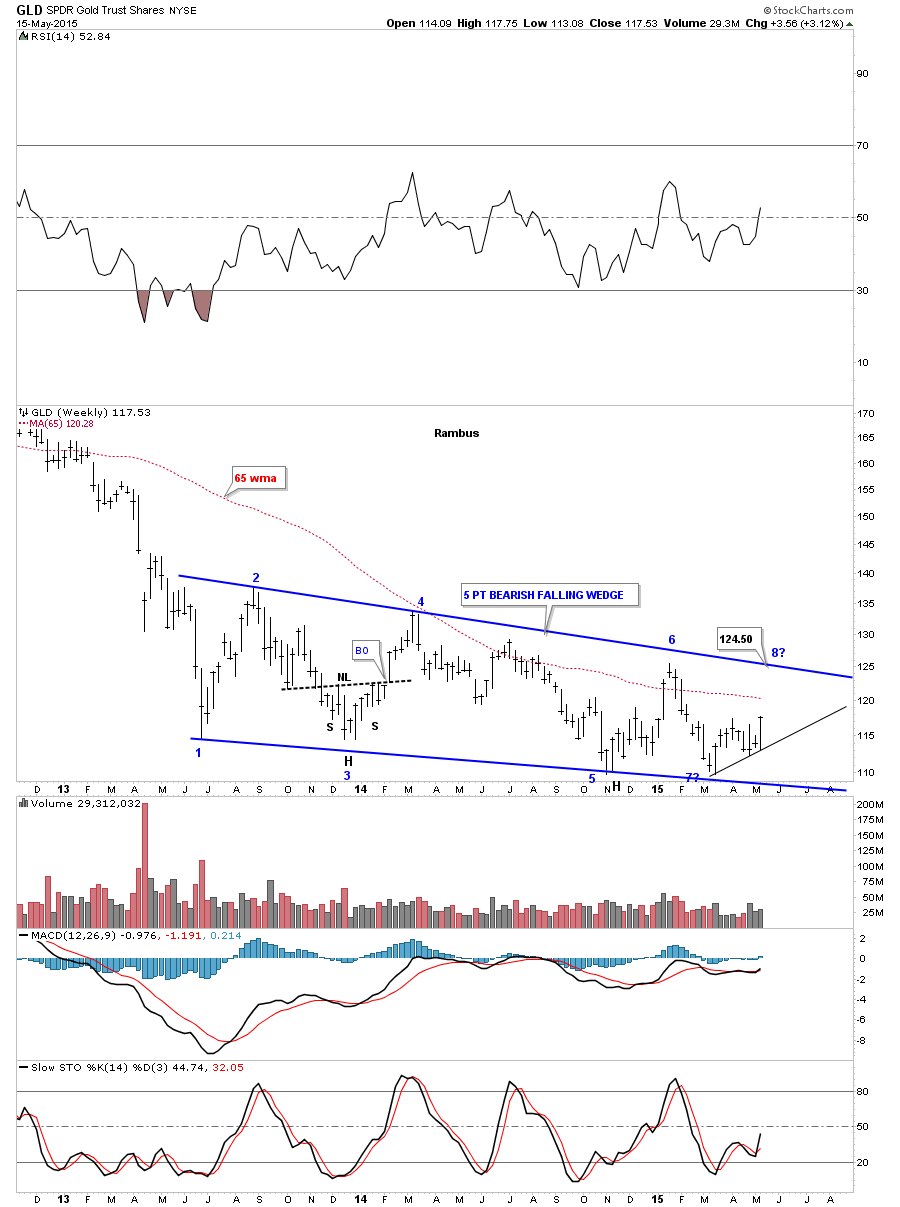
The top rail of the almost 2 year falling wedge comes in at you guessed it 124.50. GLD is now beginning its 7th reversal point to the upside. If it reaches the top rail that could very well be a big inflection point where GLD could go either way. If it breaks up through the top rail with some strength GLD will have completed 7 reversal points making this 2 year falling wedge a reversal pattern to the upside instead of a consolidation patten to the downside. So now we wait and see what GLD gives us to work with over the next important several day. Have a great Weekend and all the best ….Rambus