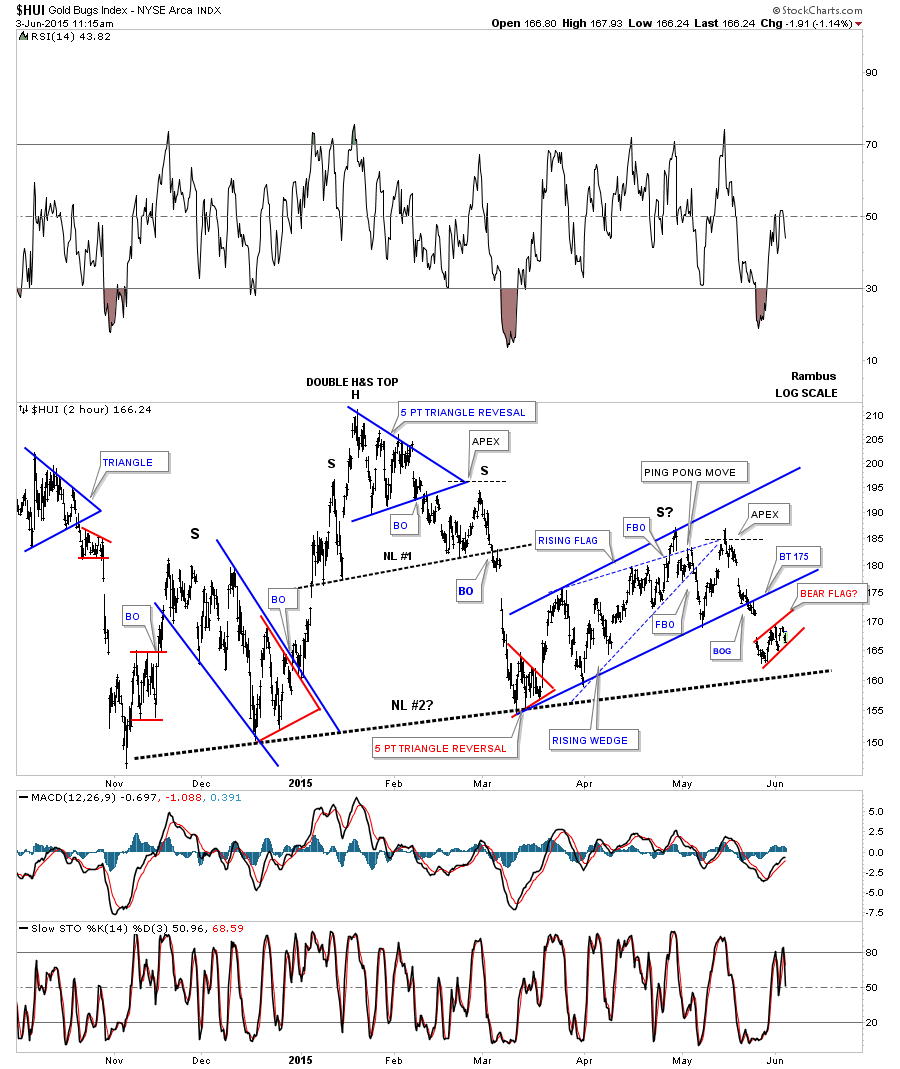
Below is a 2 hour chart for the HUI that we’ve been following since the all important low from last November. This chart shows you all the Chartology from that November low which I’ve been viewing as a H&S consolidation pattern. So basically the whole correction has been a H&S consolidation pattern within the bear market decline. This is not a reversal pattern but a continuation pattern. After breaking out from the blue morphing rising wedge last week it now appears the HUI is building out a small red bear flag. As you can see the big neckline is fast approaching.
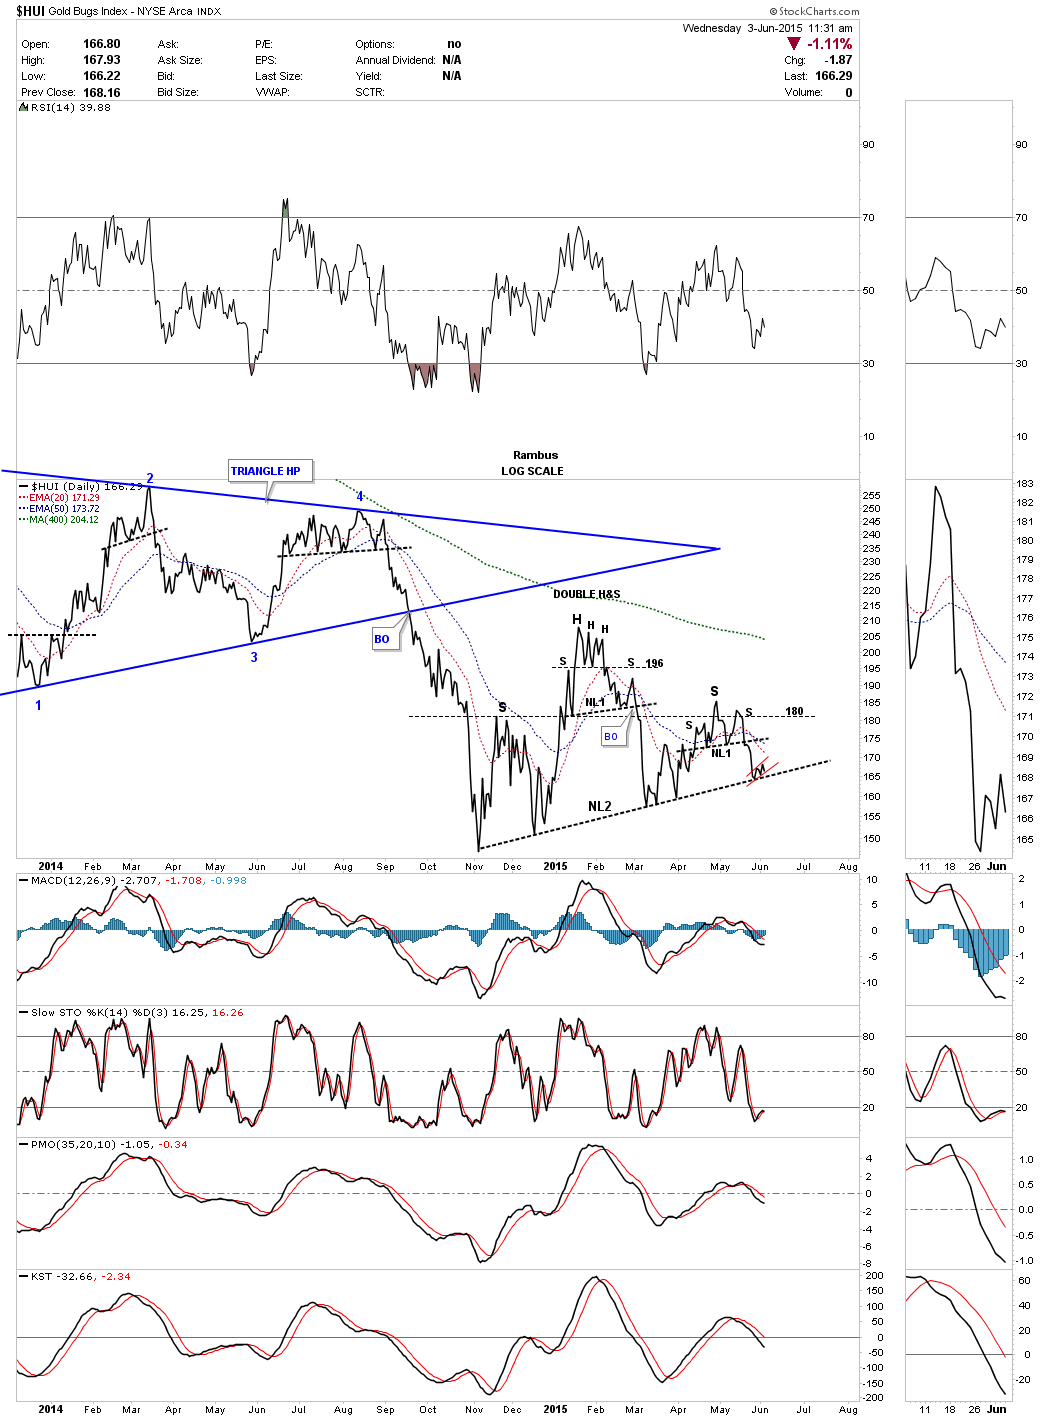
Many times in the past you have heard me mention that a line chart can often times gives you a quicker breakout signal vs a bar chart. Below is a daily line chart for the HUI which shows the price action is testing the neckline. That little red bear flag on the 2 hour chart above is sitting right on the neckline on this daily line chart below. All the indicators are negative with the 20 ema crossing below the 50 ema just recently. It’s possible that this 7 month consolidation phase maybe coming to an end. A good solid breakout through the neckline will confirm the next impulse move down.