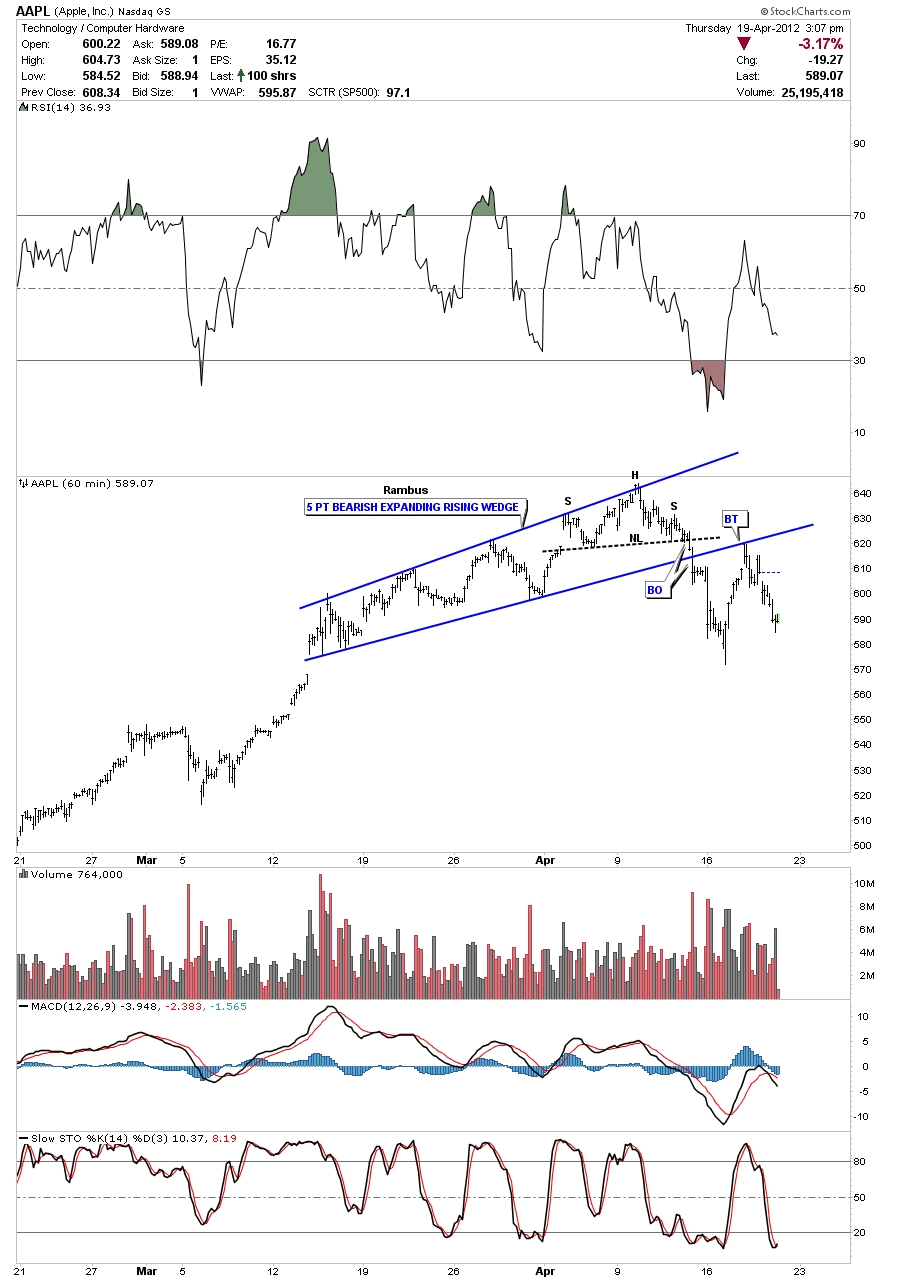
Below is a 60 minute chart I’ve been tracking Apple Computer with. After putting in a small H&S top pattern AAPL then went on to break the bottom blue rail of the 5 point bearish expanding rising wedge. You can see the initial break was pretty hard. The backtest to the bottom blue rail of the expanding rising wedge was spot on. So now all the work is done with the breakout and backtesting. As it was a parabolic move up the chances are real good that the move down will be just as fast if not faster than the move up.
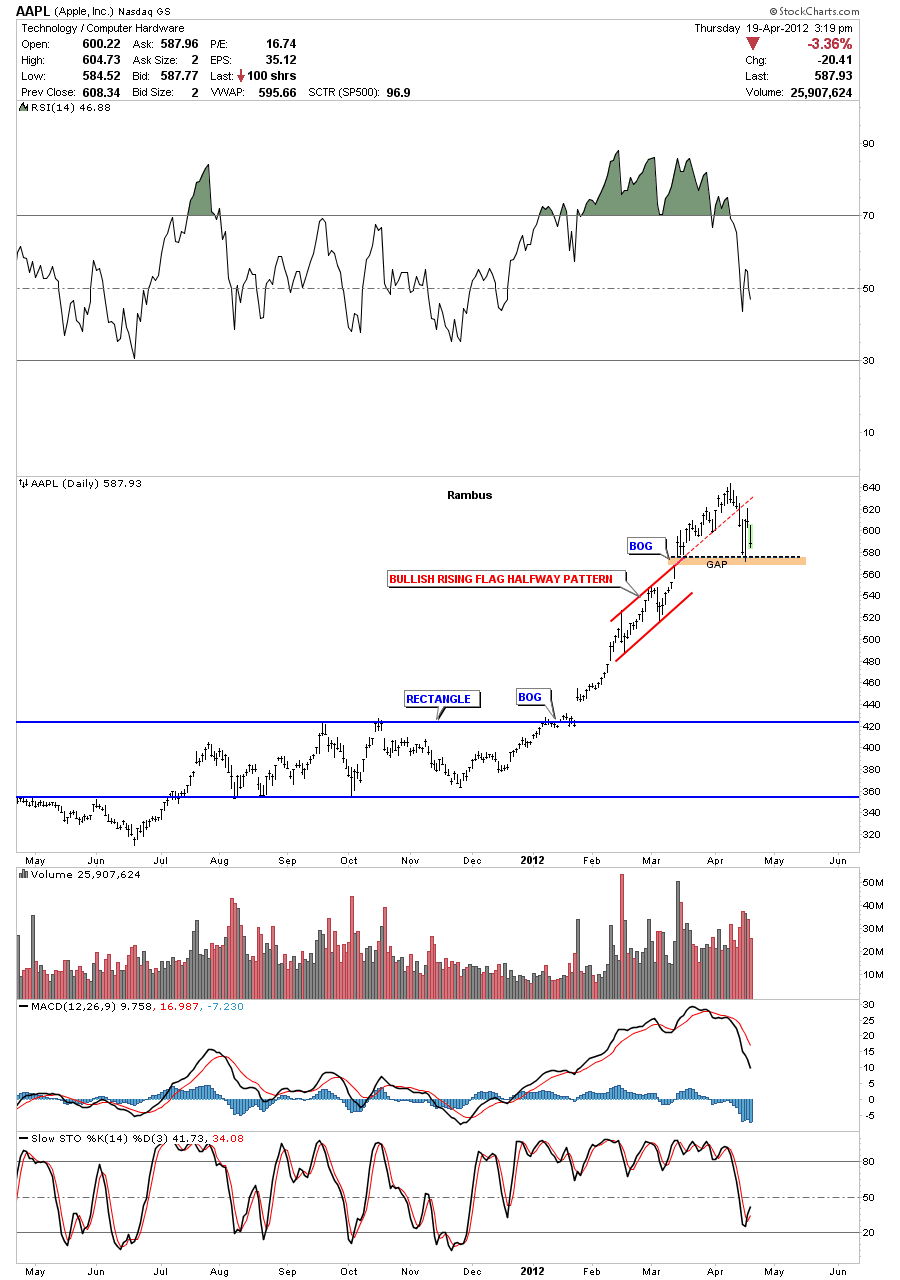
The daily chart for Apple Computer shows a big gap just below the most recent low. A close below that gap will help insure the top is in.
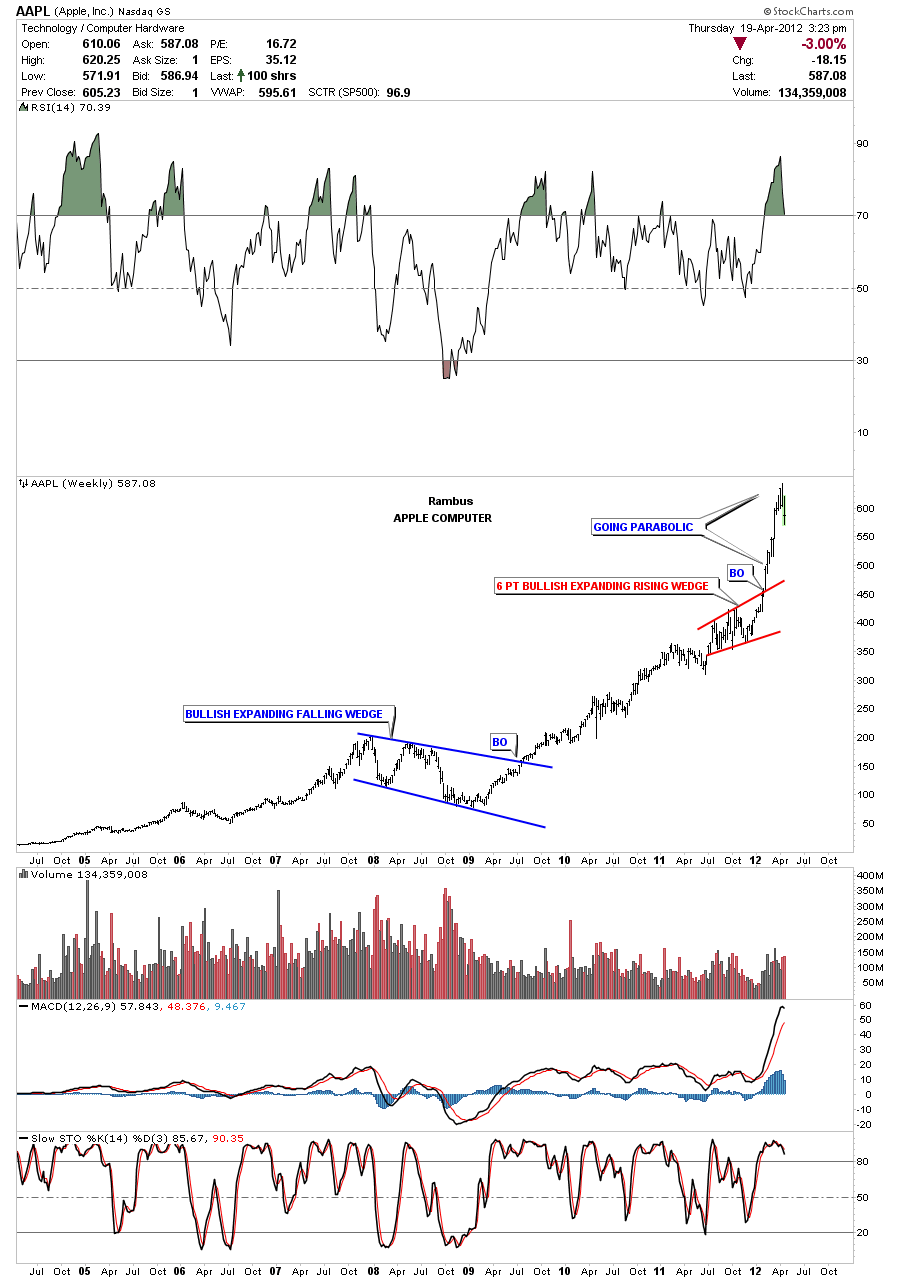
The weekly chart shows the near vertical move Apple made once it broke out from the 6 point bullish expanding rising wedge.


