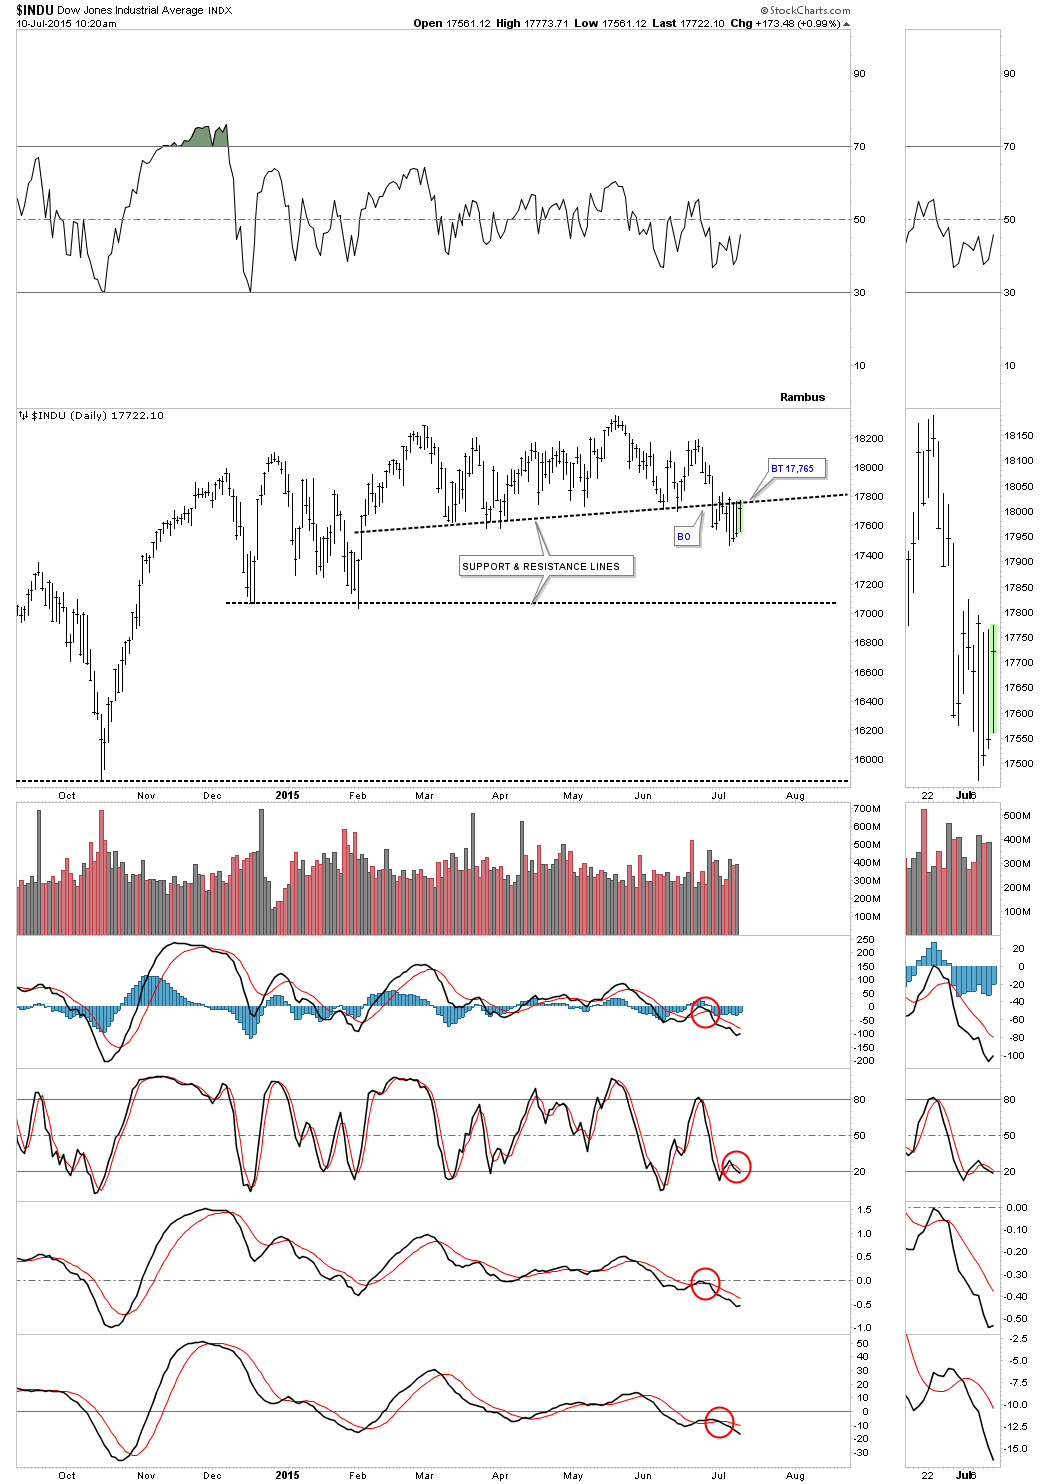
This week has been very volatile in the US stock markets as you well know. The volatility started two weeks ago when the Dow dropped 350 points on a Monday I believe. That decline broke an important support and resistance line that had held support since March. This volatility has taken place just below that important support and resistance line which so far is holding as the backtest. The indicators are still bearish for the most part.
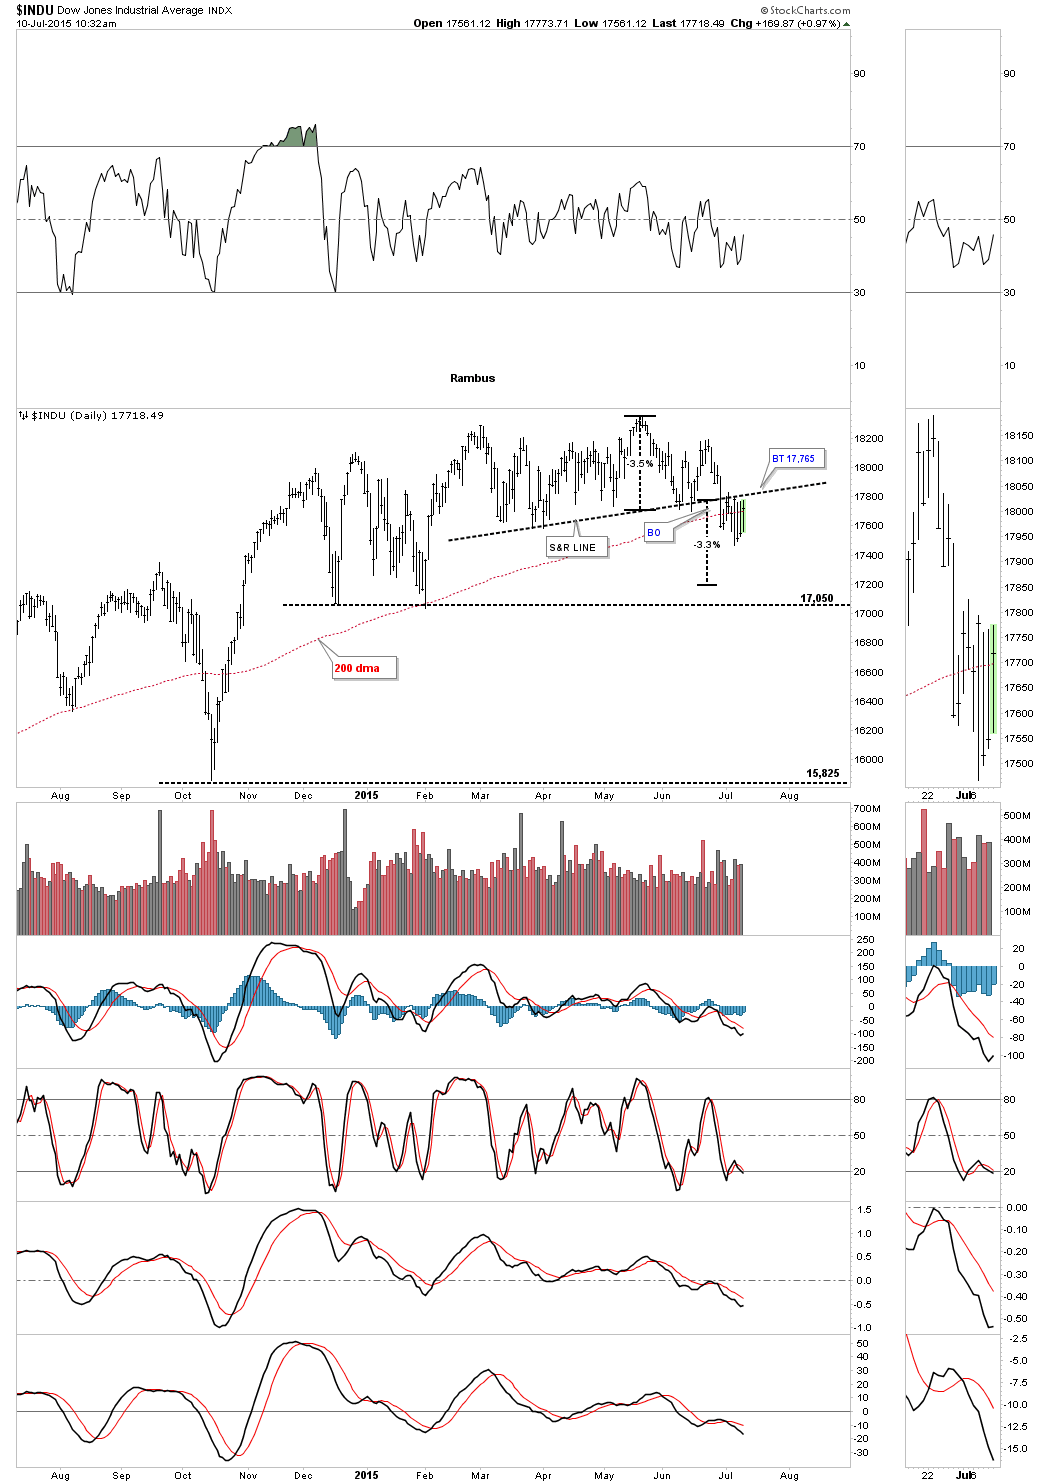
Below is another daily chart for the Dow which is showing the 200 dma. I also added a short term price objective if this important support and resistance line holds as the backtest. From top to bottom it would give the Dow about a 7% correction at a minimum. The December and February lows would actually be the next area of support around the 17,050 area.
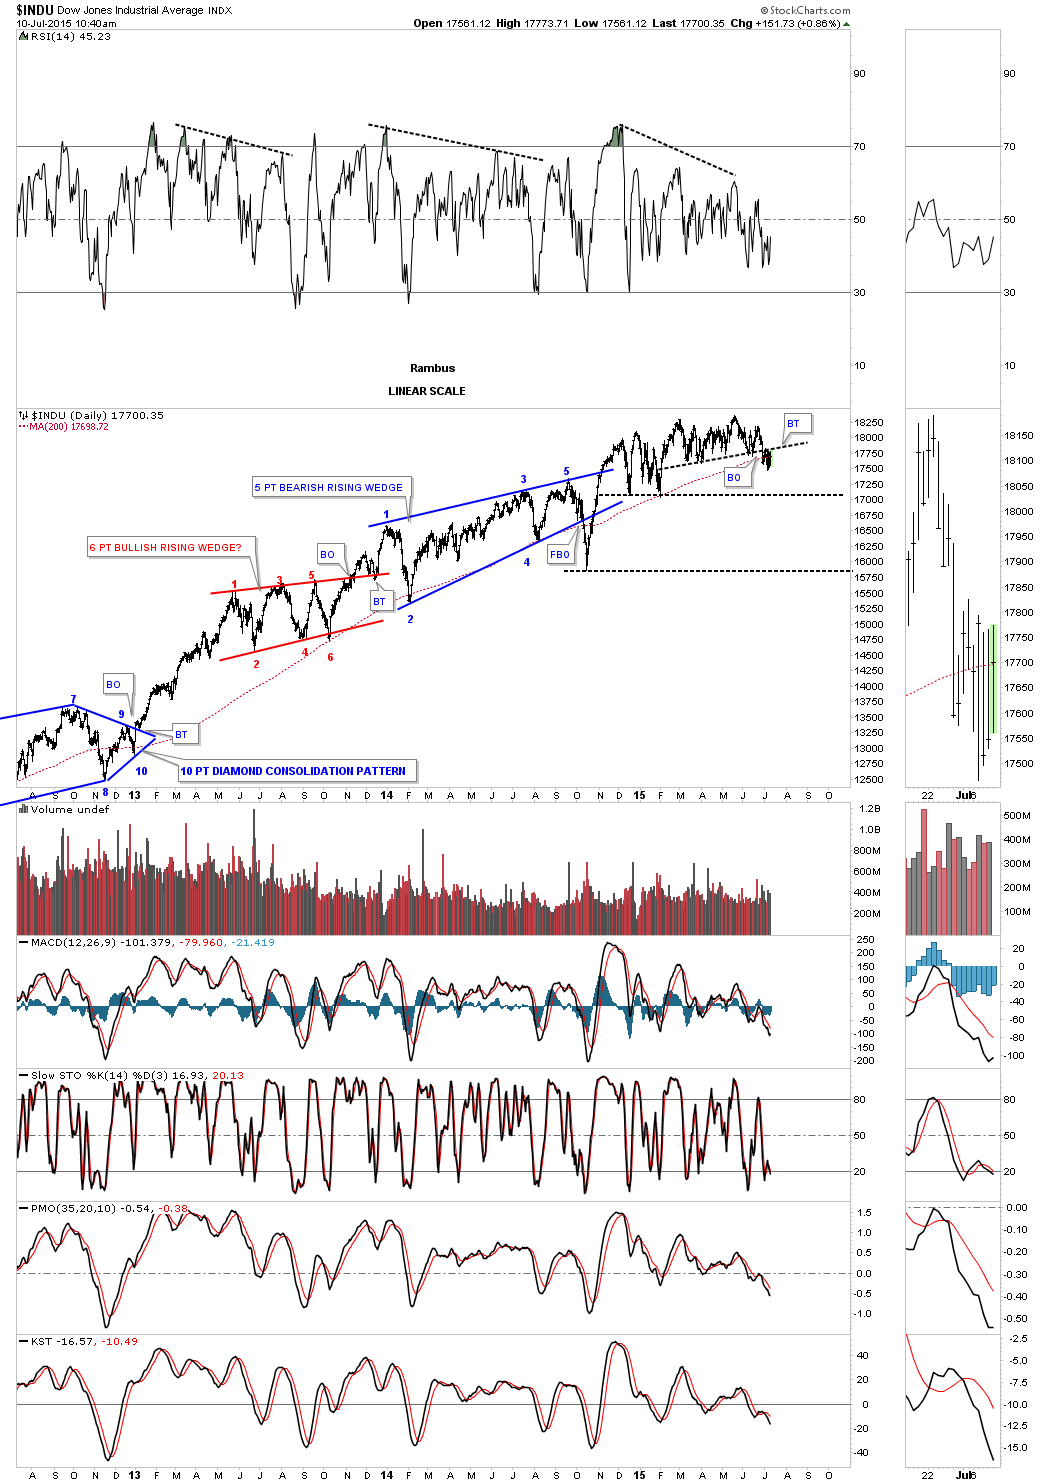
The long term daily chart for the Dow shows how the breakout and backtest looks along with the 200 dma.
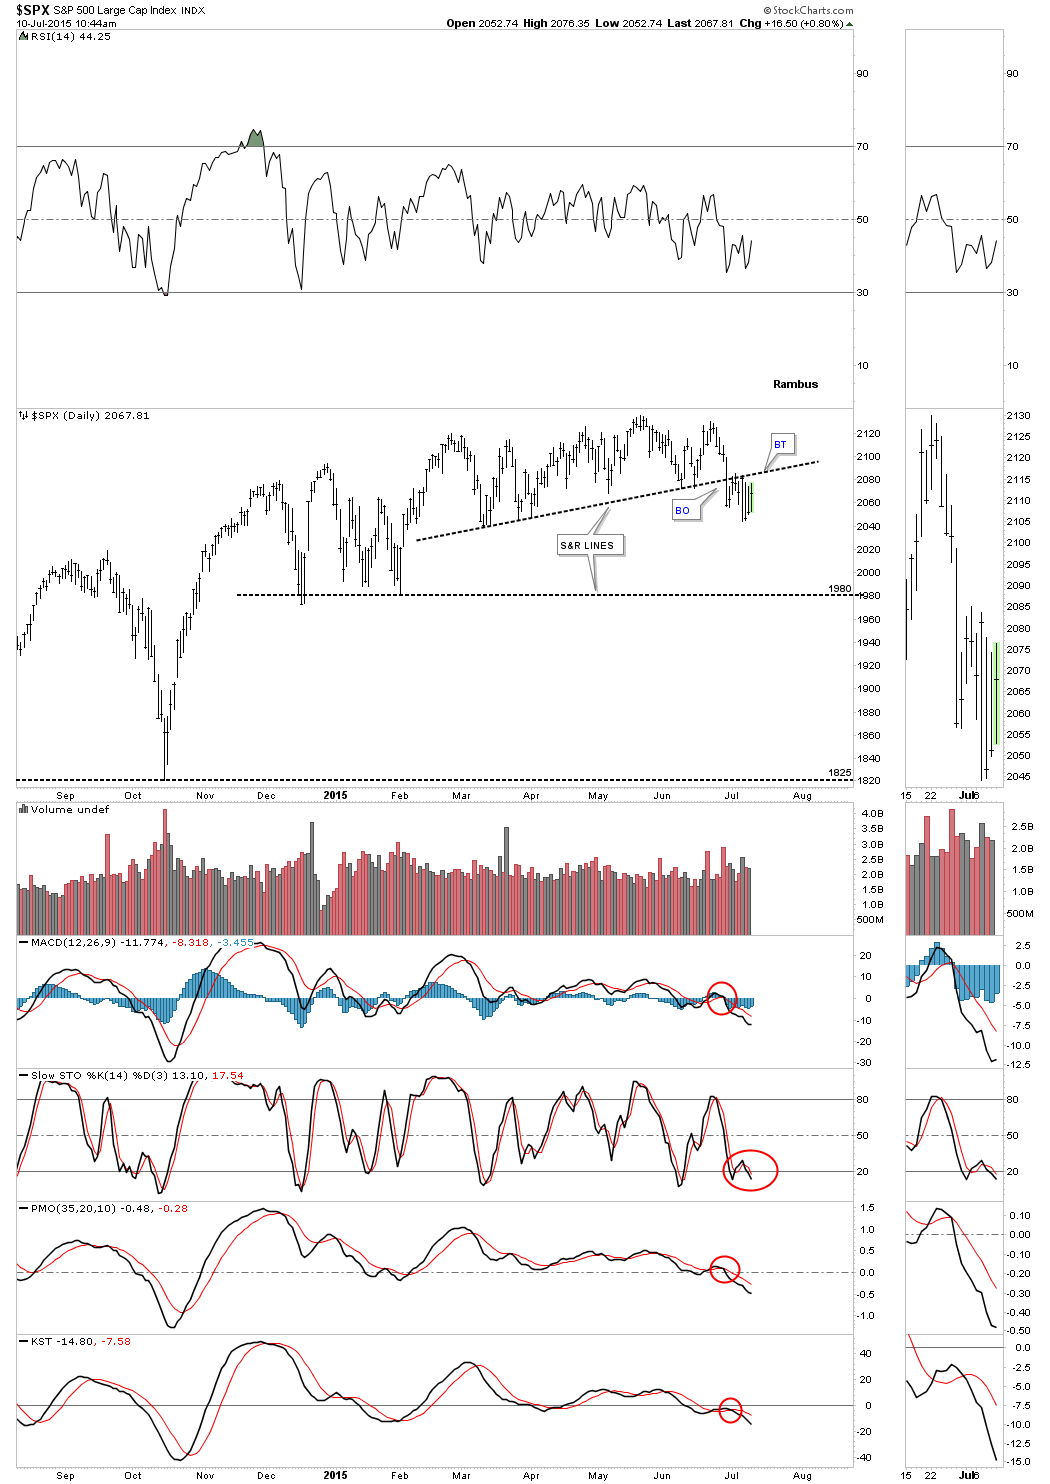
The daily chart for the SPX shows the big breakout day from two weeks ago and the backtest that has been taking place.
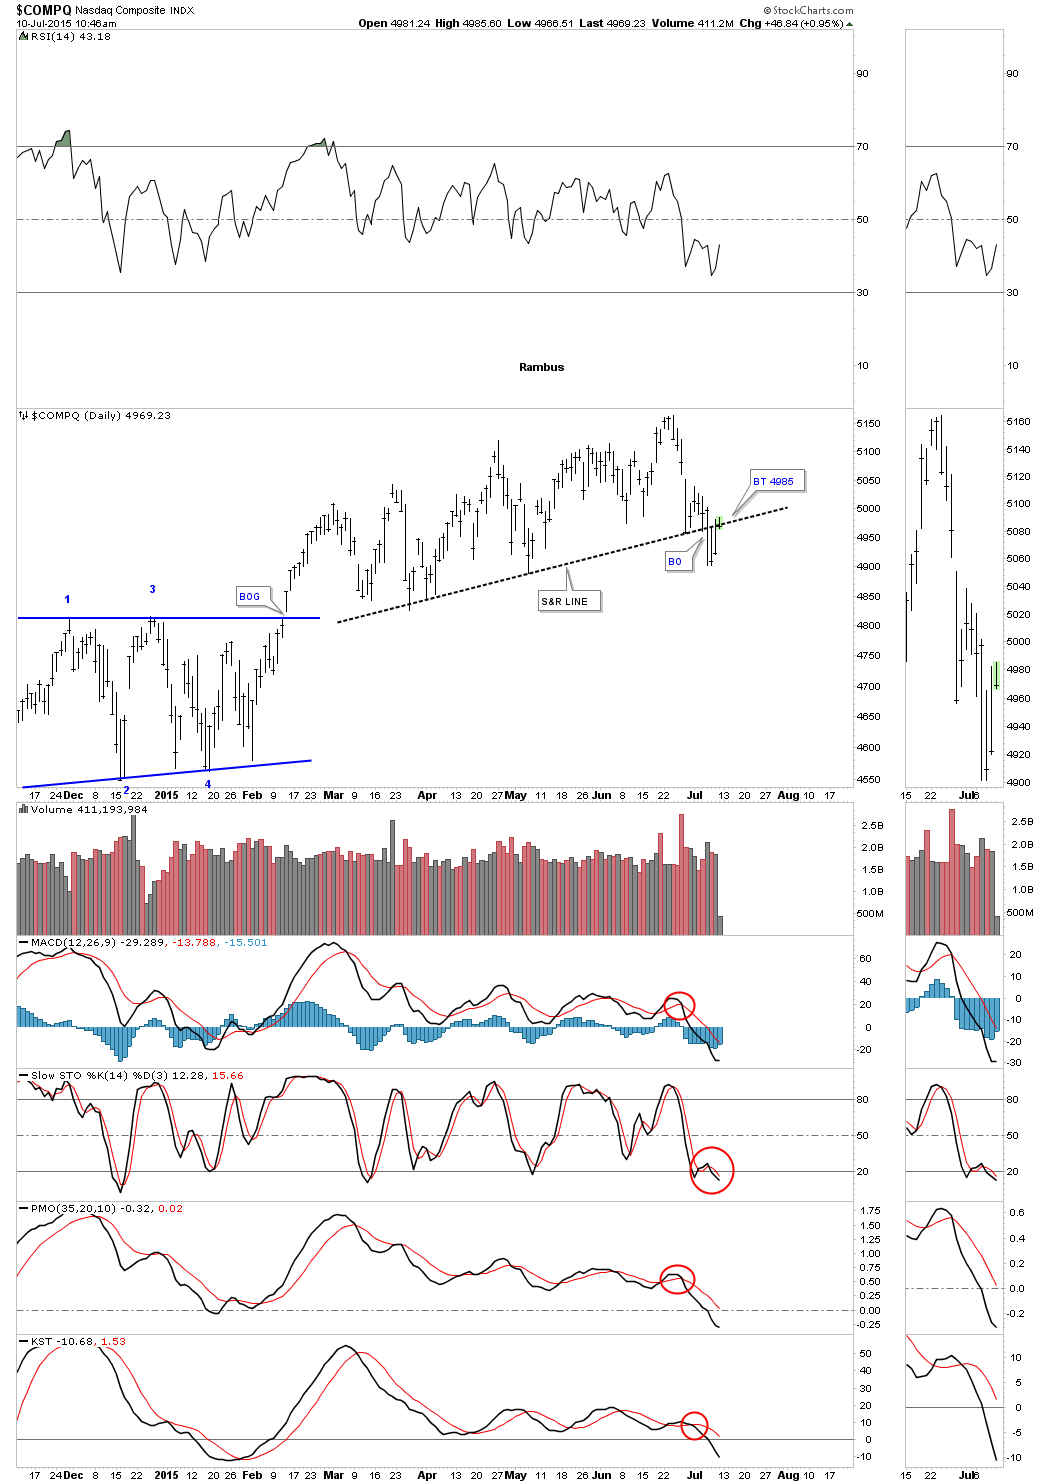
The daily chart for the COMPQ shows a similar setup to the Dow and SPX and is strongly backtesting its support and resistance line today as well.