If one is looking for a continuation of the deflationary environment we have found ourselves in since the 2011 top in the commodities complex, copper would be a very important piece of the puzzle. The general theory is that if copper is doing good so should the economy and vise versa. So how does copper look these days?
It looks like the Energizer Bunny may be running out of energy .
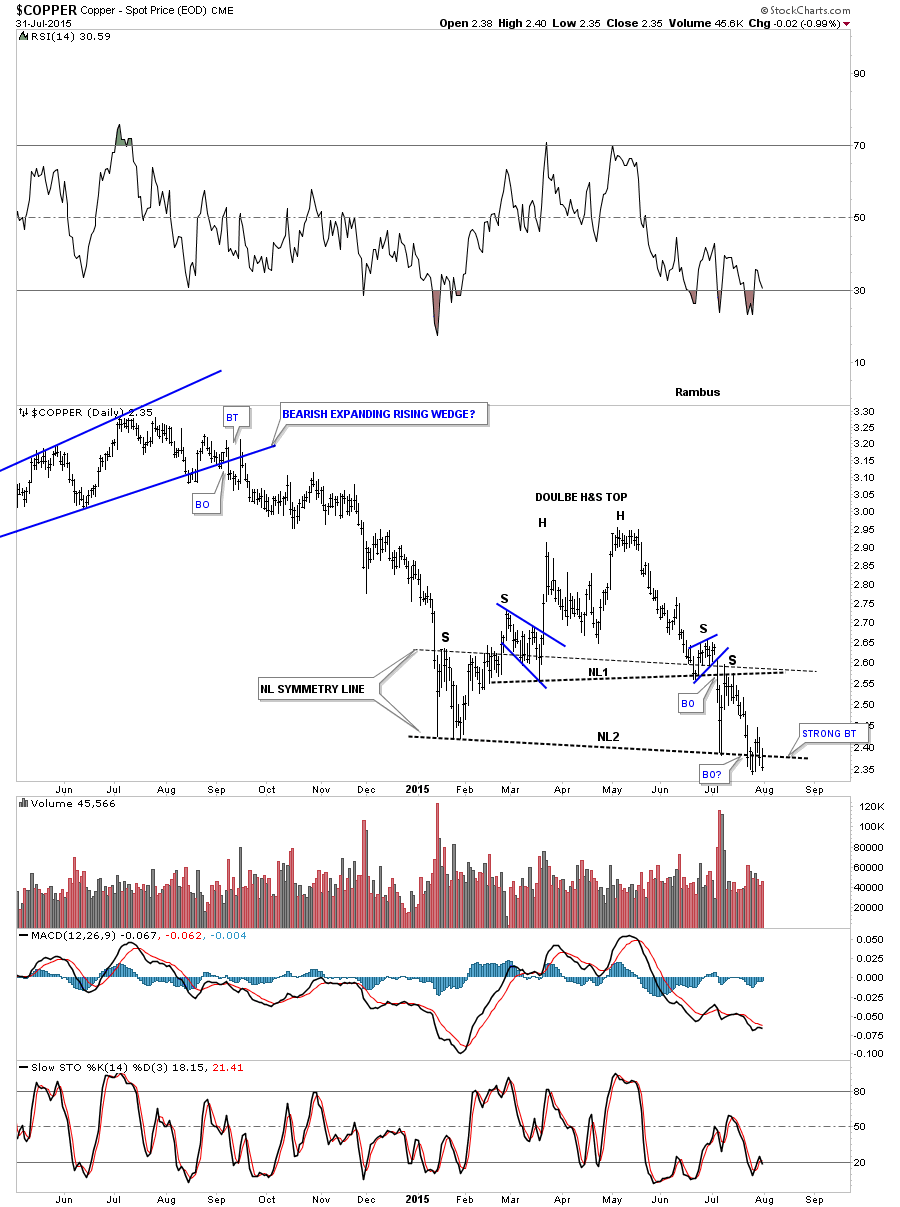
Lets start with a daily chart for copper which is showing us a double H&S top that is in the process of breaking below neckline #2 which had a strong backtest this week. The H&S pattern is very symmetrical as shown by the neckline symmetry line that measures the height for the left and right shoulders. The head of the H&S top is a double top that reversed the rally that started at the beginning of this year. Outside of the strong backtest this week this H&S consolidation pattern looks very good. We just need to see some follow through to the downside for confirmation.
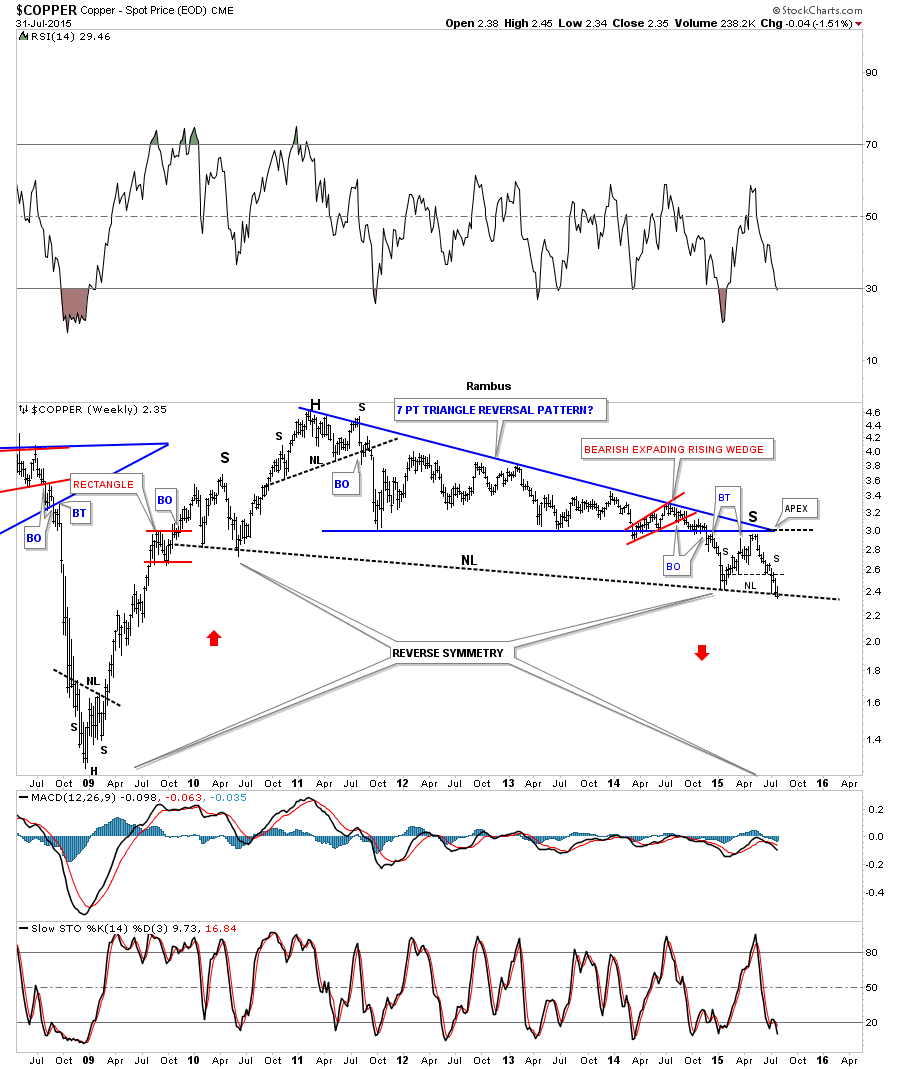
The weekly chart for copper shows some nice Chartology also. Since the bull market ended in 2011, along with most other commodities and the precious metals sector, copper has been building out a massive blue 7 point triangle reversal pattern that is actually the head of an even bigger H&S topping pattern. Copper broke below the bottom blue rail of the triangle reversal pattern late last year and has been building out the H&S consolidation pattern as the backtest and right shoulder which I showed you on the daily chart above. What is also interesting about this long term weekly chart is the neckline I showed you on the daily chart above, which took about six months to build out, is also the same neckline of the massive H&S top that stretches back over six years. Copper closed this week at a new multi year low.
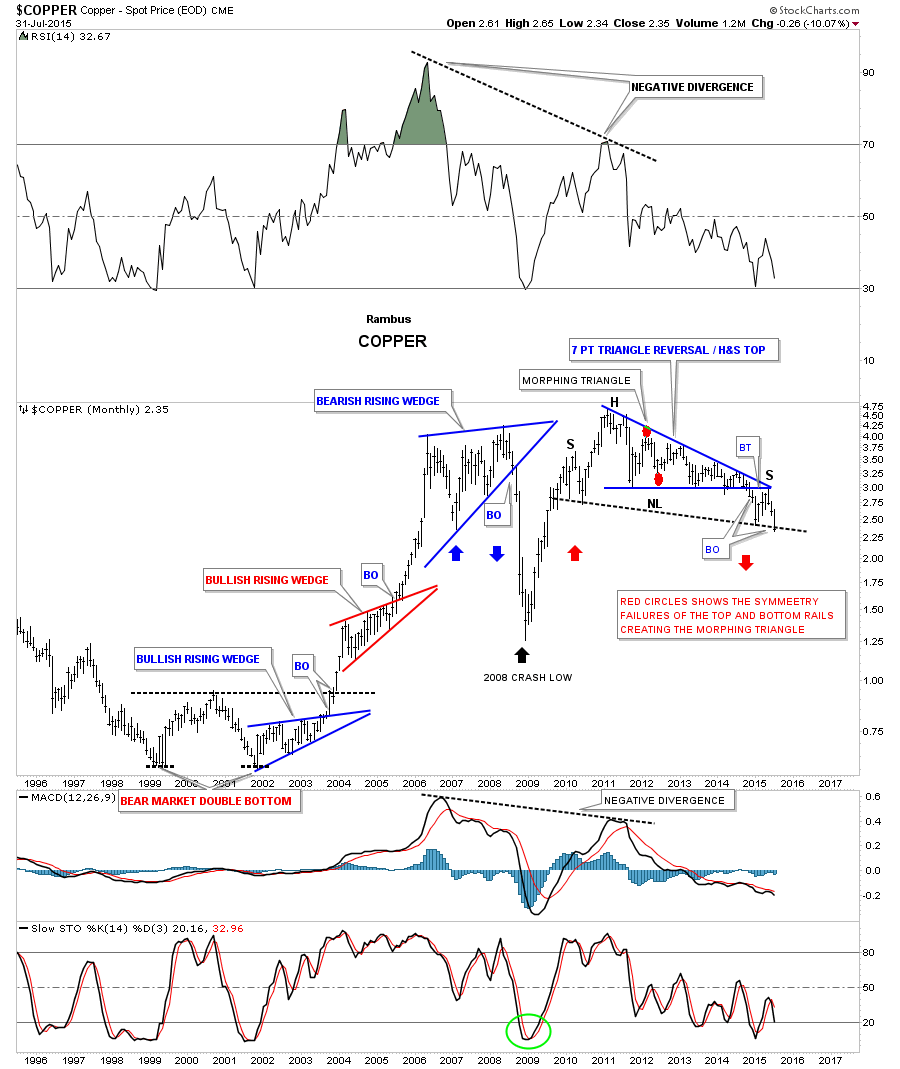
The 20 year monthly chart for copper shows its beautiful bull market that began with a three year double bottom reversal pattern. Whenever you see a bullish rising wedge in an uptrend you know the move is strong. Copper formed two bullish rising wedges during its bull market. The big combo topping pattern may show us some reverse symmetry to the downside as the rally off of the 2008 crash low was very strong and straight up, red arrows. The blue arrows shows you some reverse symmetry that formed during the vertical move up out of the red bullish rising wedge and the 2008 crash. The massive H&S top is just a few months longer in time than the double bottom which is another form of reverse symmetry. These charts above show copper right on the verge of really entering into its next impulse move down continuing its bear market that began in 2011. Have a great weekend. All the best…Rambus
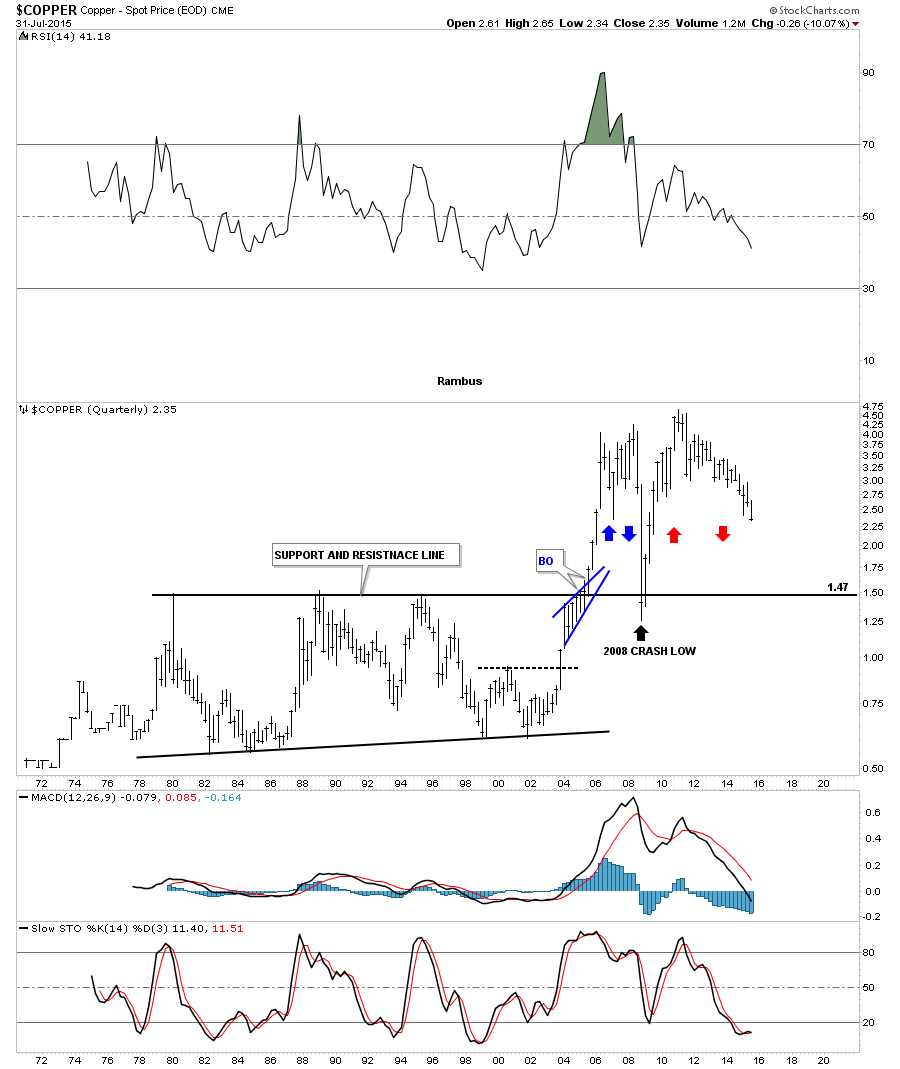
PS: Below is a 45 year chart for copper for your viewing pleasure.