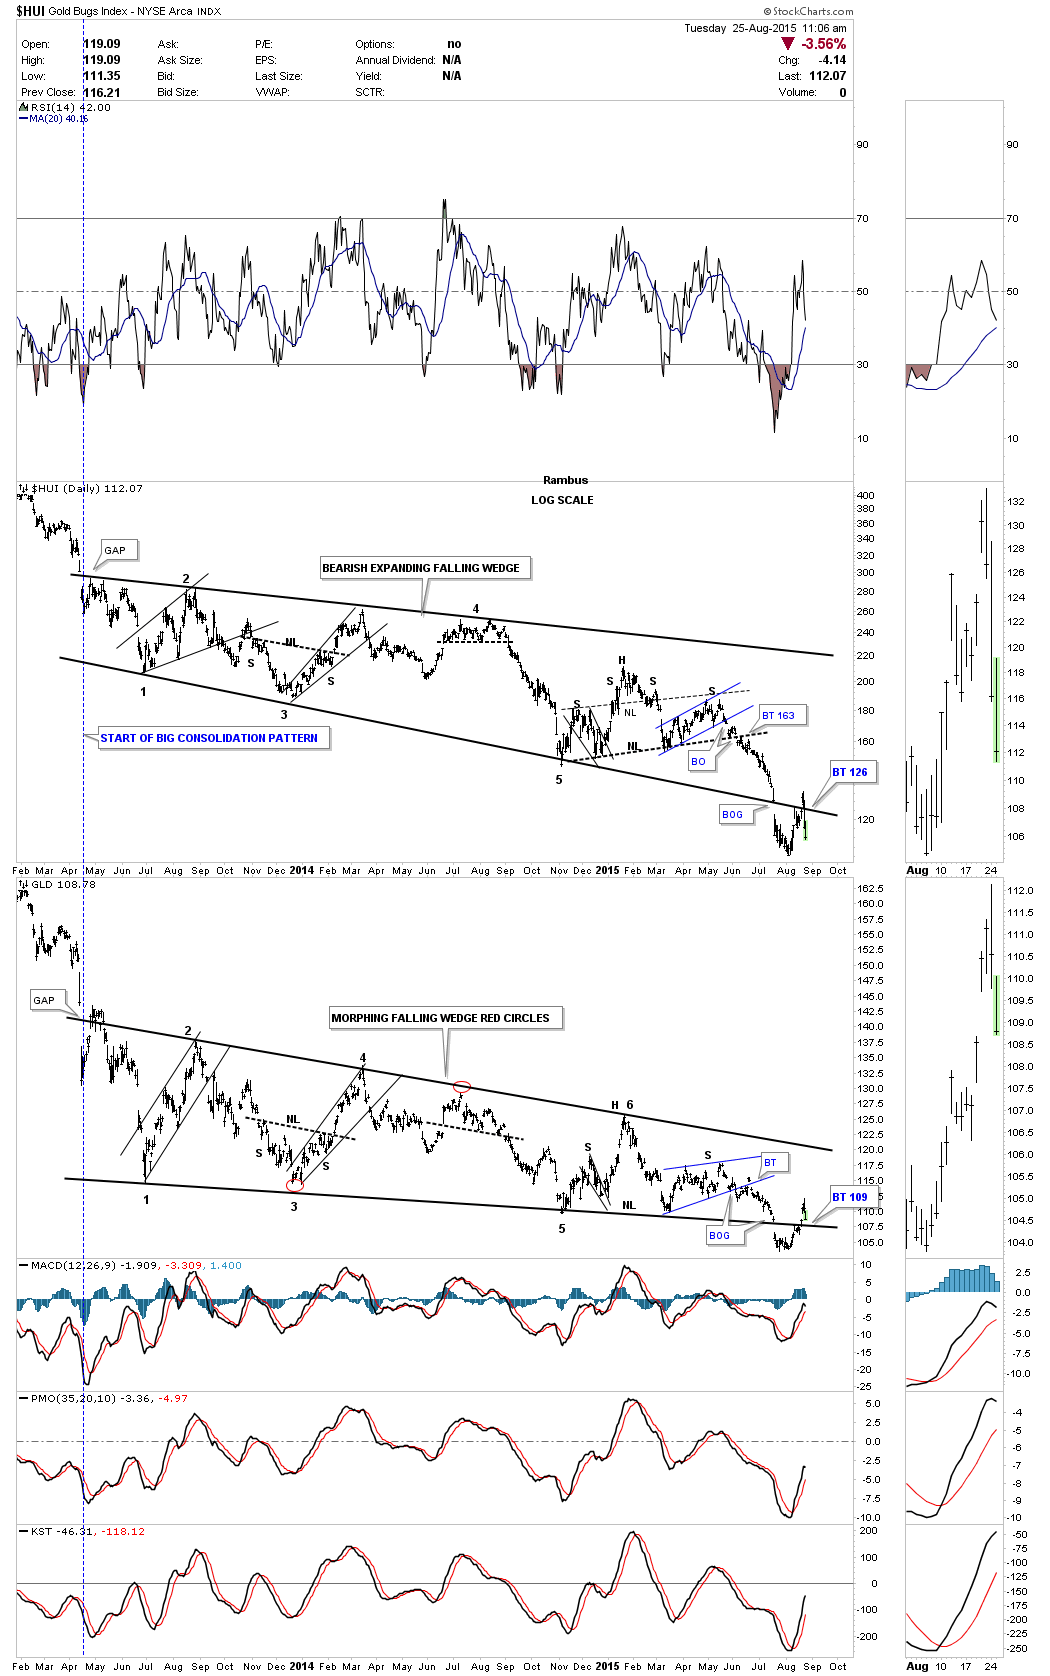
Below is the combo chart we’ve been following very closely which shows the HUI and GLD with their respective big consolidation patterns. As you can see they both gapped below the bottom rail of their two plus years consolidation patterns only to have a small selloff. It looked like the initial backtest was going to hold resistance but that wasn’t the case. After the initial backtest they both sold off for a few days only to gap back up and over the bottom black trendline. I have to admit that was very disappointing to me as we’ve been watching this chart for a very long time and everything worked out just like I had hoped it would. We got the big breakout gap on huge volume which is what I was looking for. I’m glad to see the HUI is now trading back below the bottom trendline and GLD is getting closer to breaking back below its bottom rail which will help confirm this latest price action has been just a strong backtest.
The bottom trendlines were a little tricky to put on as the consolidation patterns are so big and the lows and highs are not exactly touching the trendlines. When I see a breakout and backtest I always will update the trendlines, in this case the bottom trendline, which helps shows where the trendline should actually go. If you follow the price action of the bottom rail of each chart pattern you can see how clean the breakout and backtest are now that we have more information to work with. I believe the bottom trendline for the HUI and GLD are properly place. Keep in mind these are very big consolidation patterns that are just breaking out.