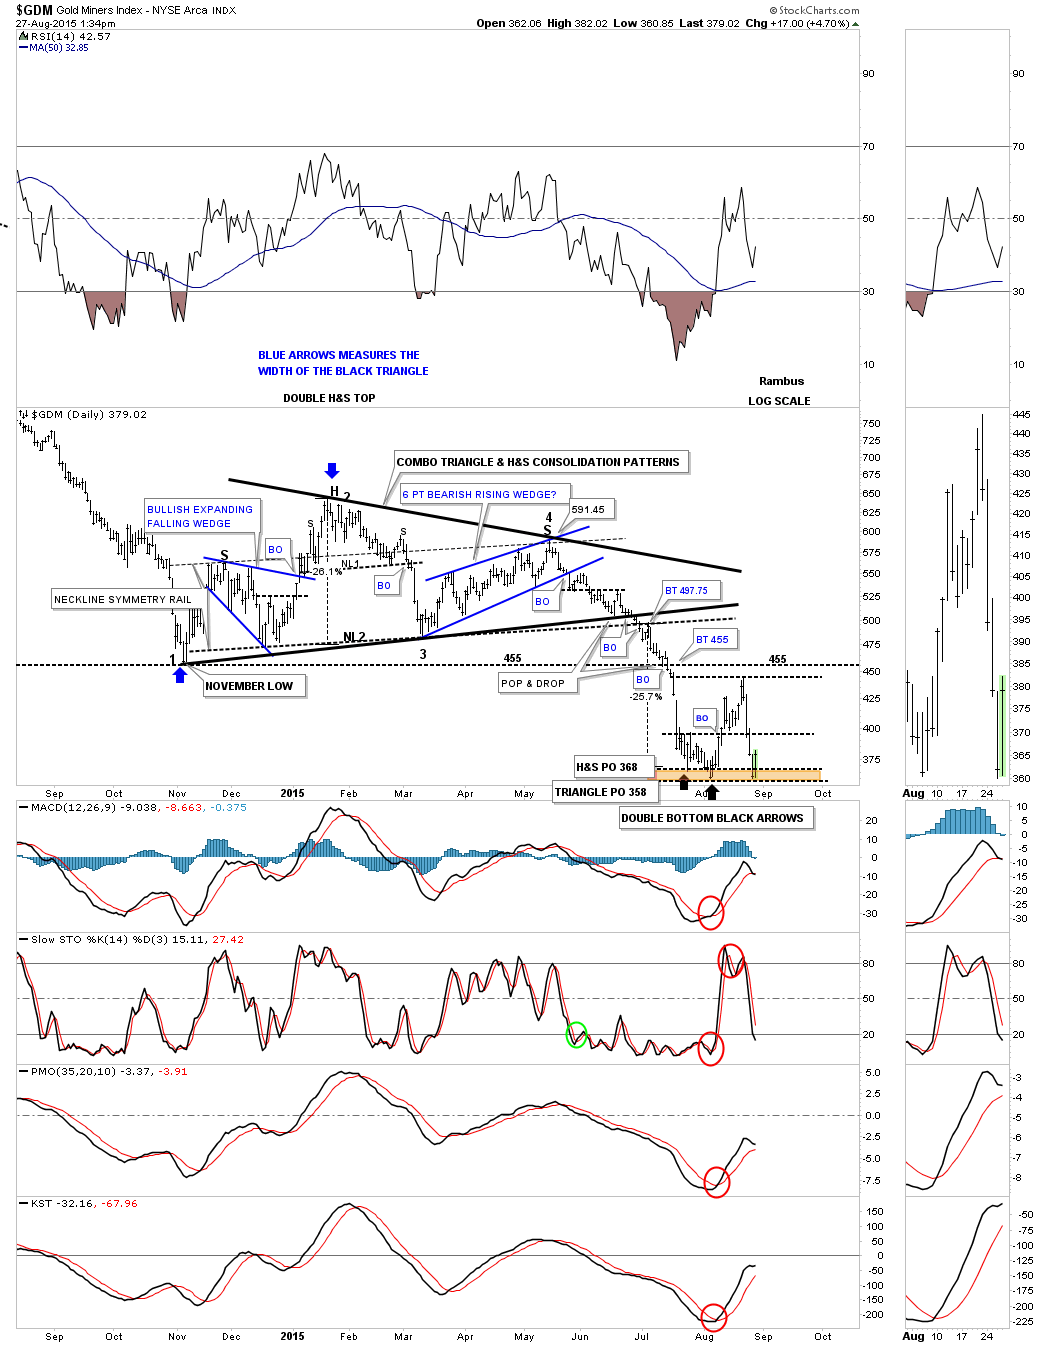
Last night in the Wednesday Report I posted this daily chart for the GDM explaining why the current low was so critical. The current low could be the third reversal point in a bigger consolidation pattern in which we would need one more counter trend rally to get the 4th reversal point. Hopefully we’ll be able to buy back our Kamikaze stocks at a lower price which means a higher price for the GDM. If this bottom doesn’t hold on the GDM we’ll have to buy the Kamikaze stocks at a higher price. Either way we’ll get positioned again when the time is right.
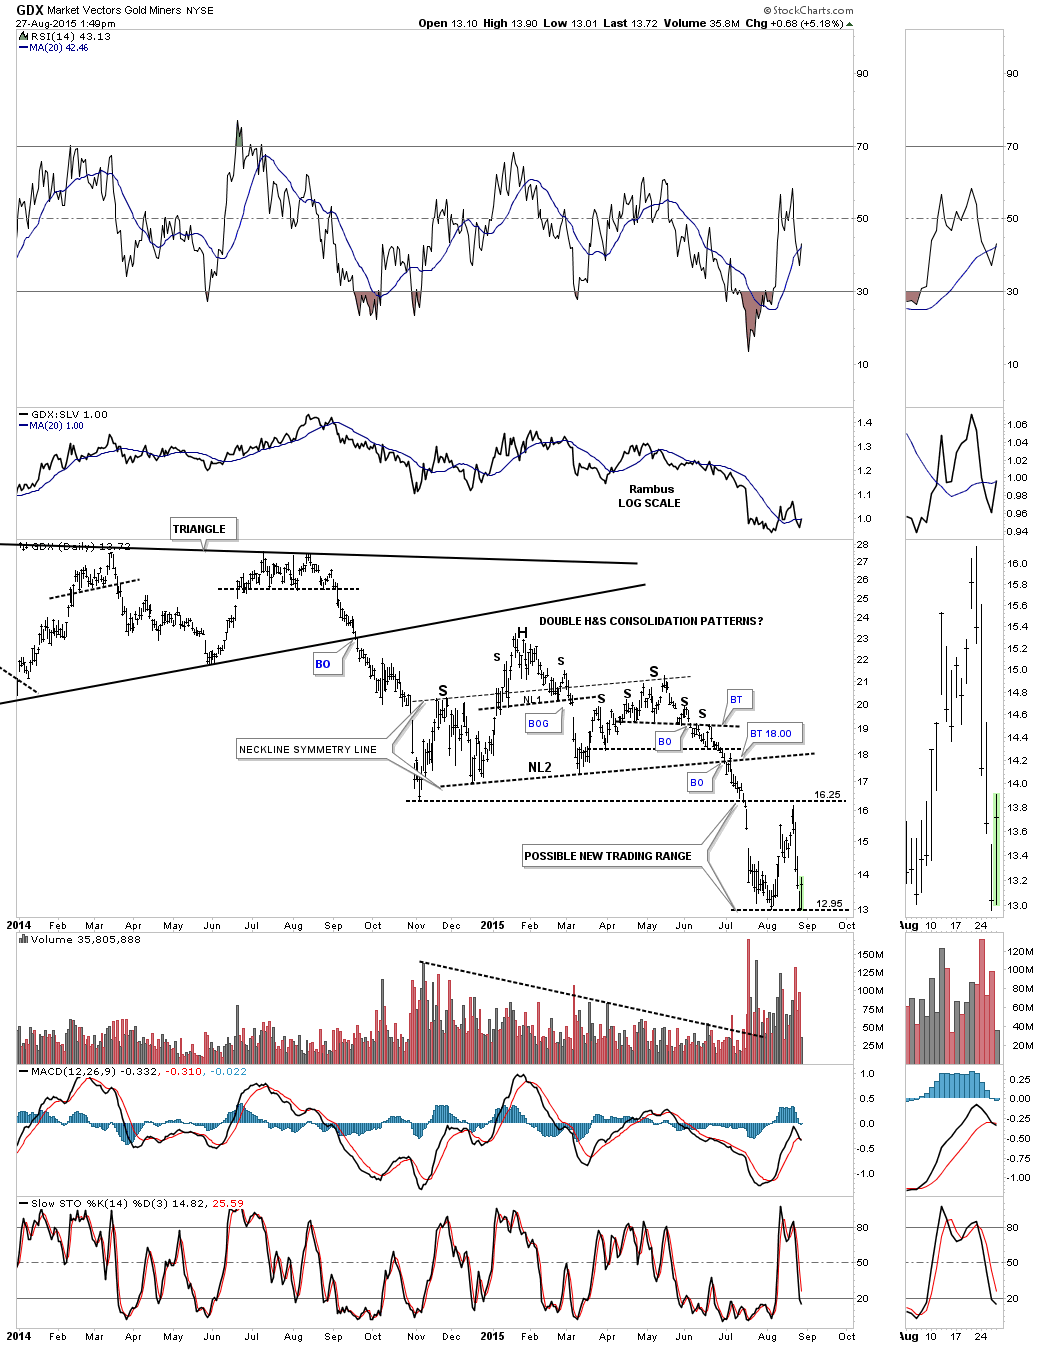
The GDX possible new trading range.
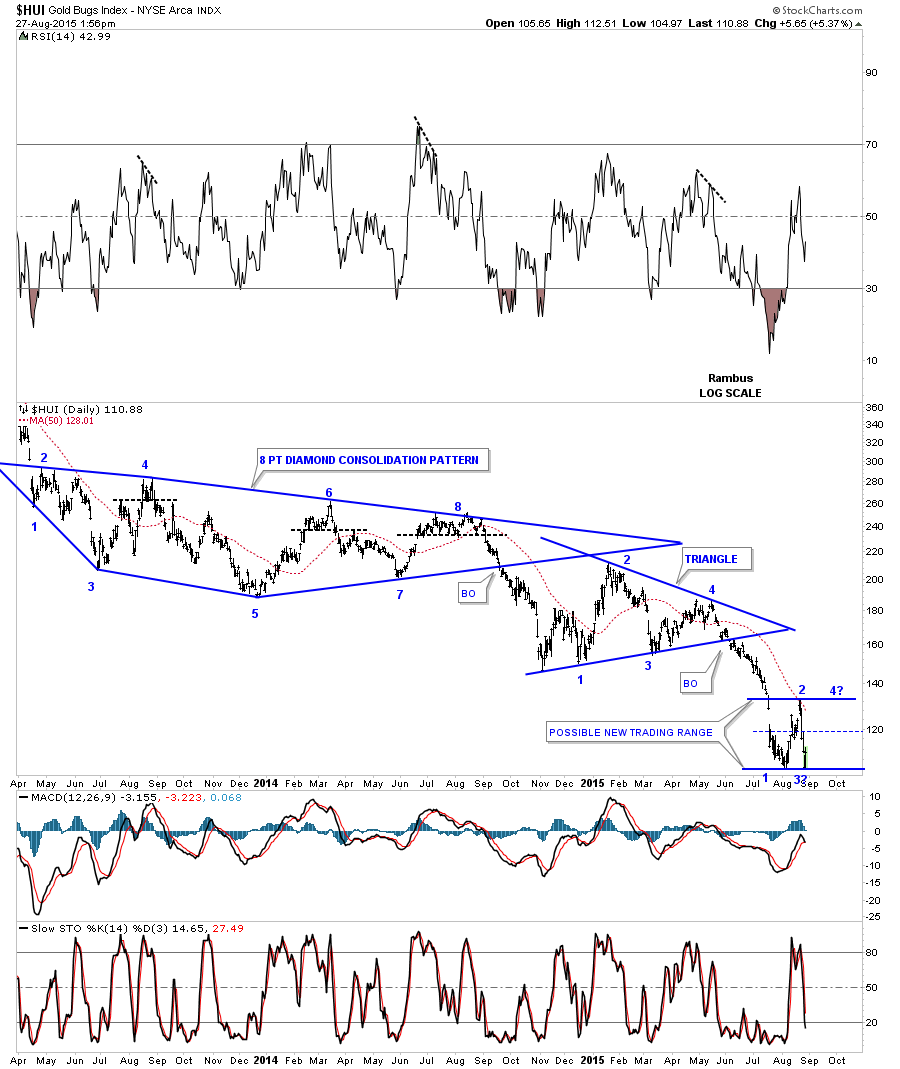
The HUI’s possible trading range with the 50 dma coming at at 128.02 right now.
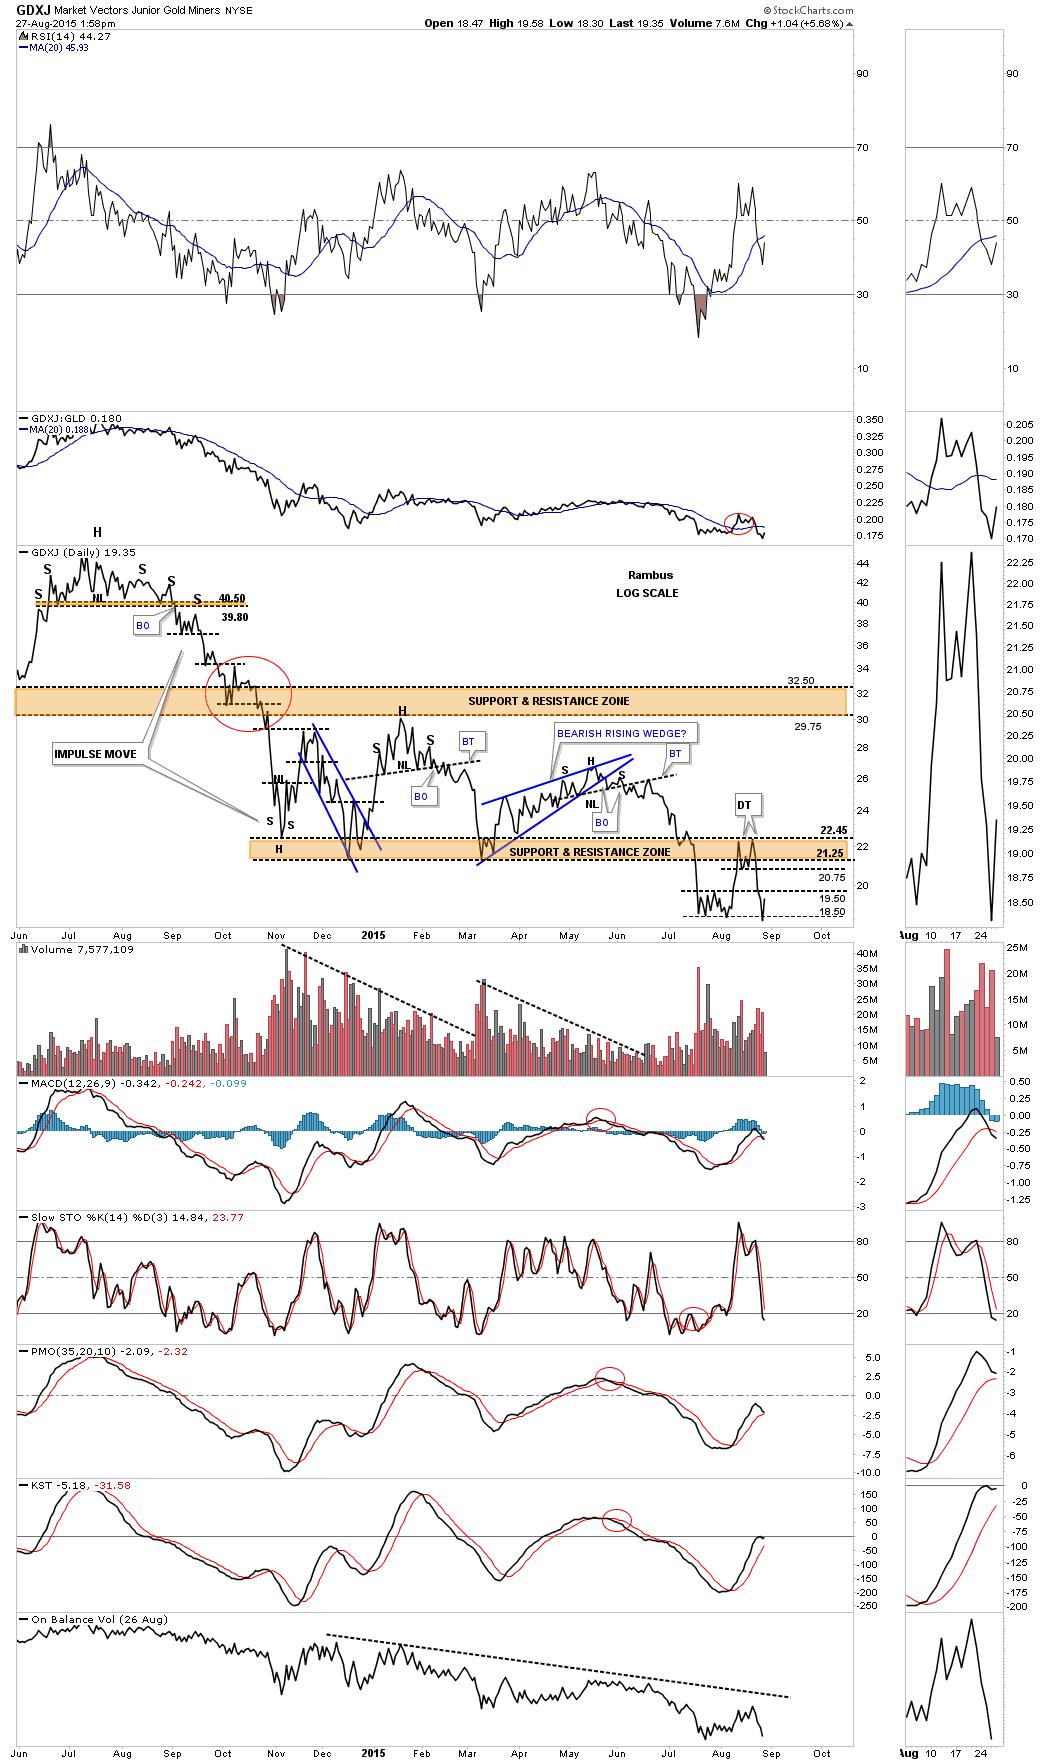
The daily line chart for the GDXJ shows the bounce and the areas of possible resistance labeled on the right side of the chart. The 19.50 area would be the highs made back in late July. Next would be the double top hump at 20.75 and then the brown shaded support and resistance zone.
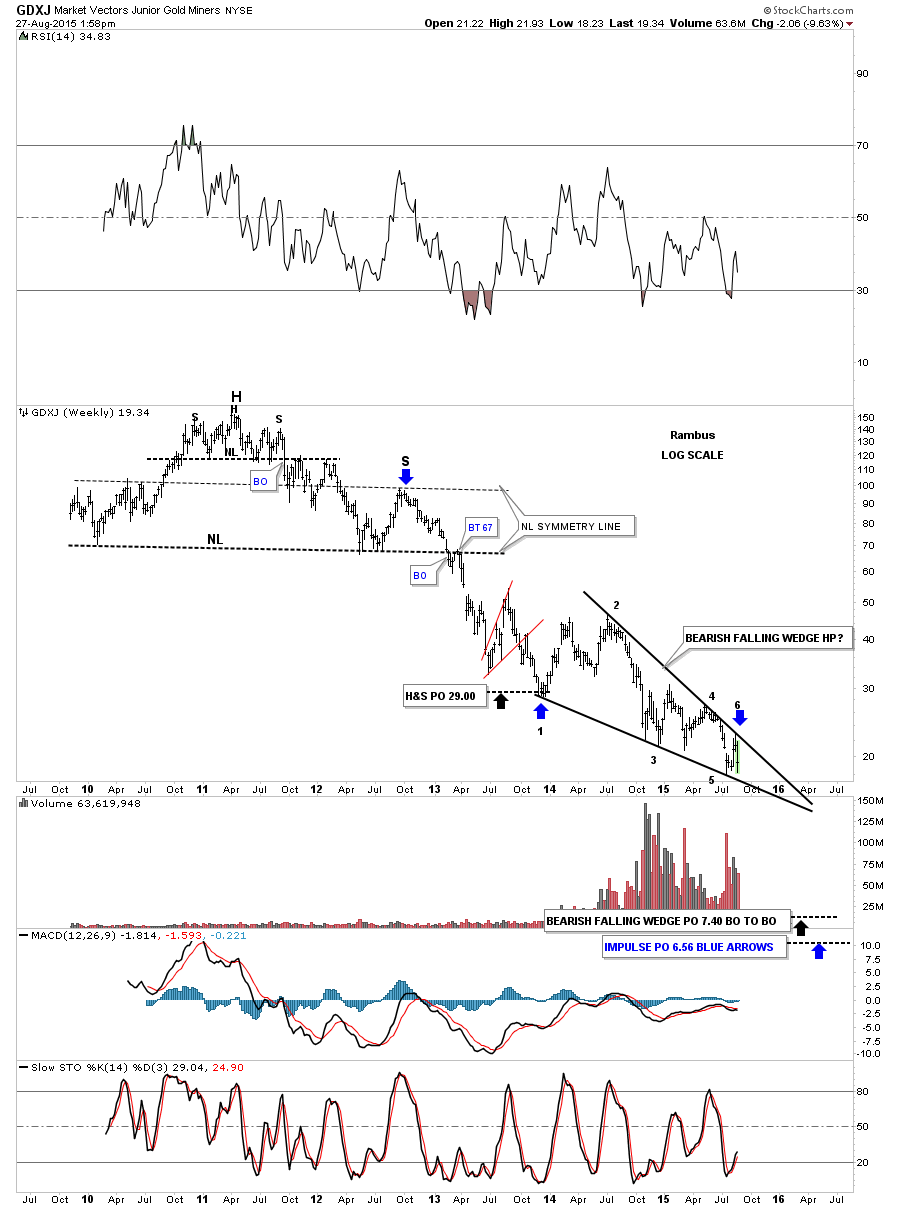
This weekly chart for the GDXJ is our main focus. We’ll have to see how the GDXJ lets us get repositioned again for the downside.