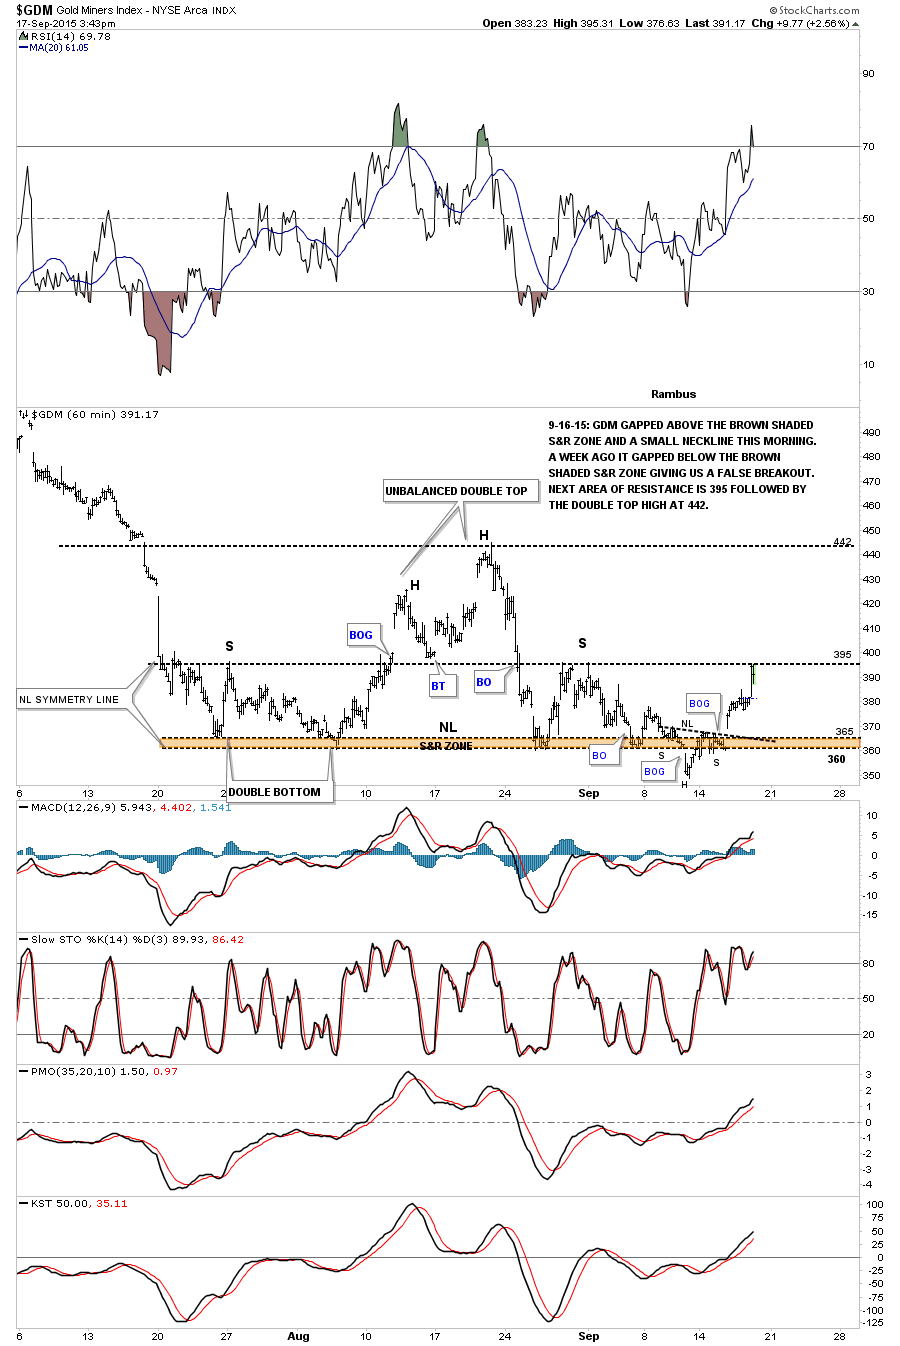
The 60 minute chart below shows the GDM running into its first resistance point at the previous left and right shoulder highs at 395. This would be a good place for it to take a little rest. A break above the 395 area would be positive for a run to the top of the potential trading range at 442. First it has to get past the 395 area.