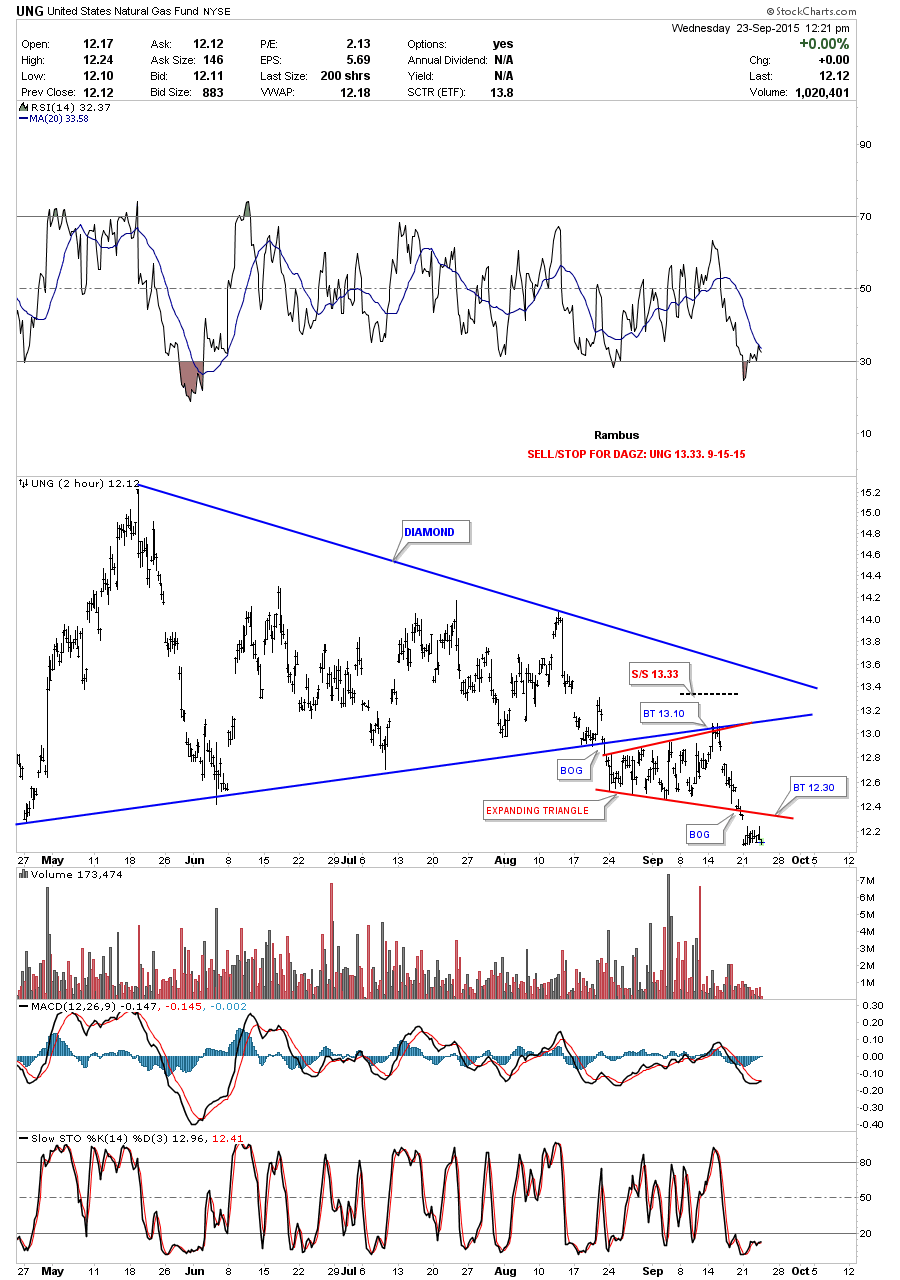
Just before the site went down we were looking to take a last position in DGAZ which is a 3 X short natural gas etf when the bottom rail of the red expanding triangle was broken to the downside. The 2 hour chart shows the price action gapping below the bottom rail of the red expanding triangle on Monday of this week. If we get a backtest to the bottom red rail it should come in around the 12.30 area.
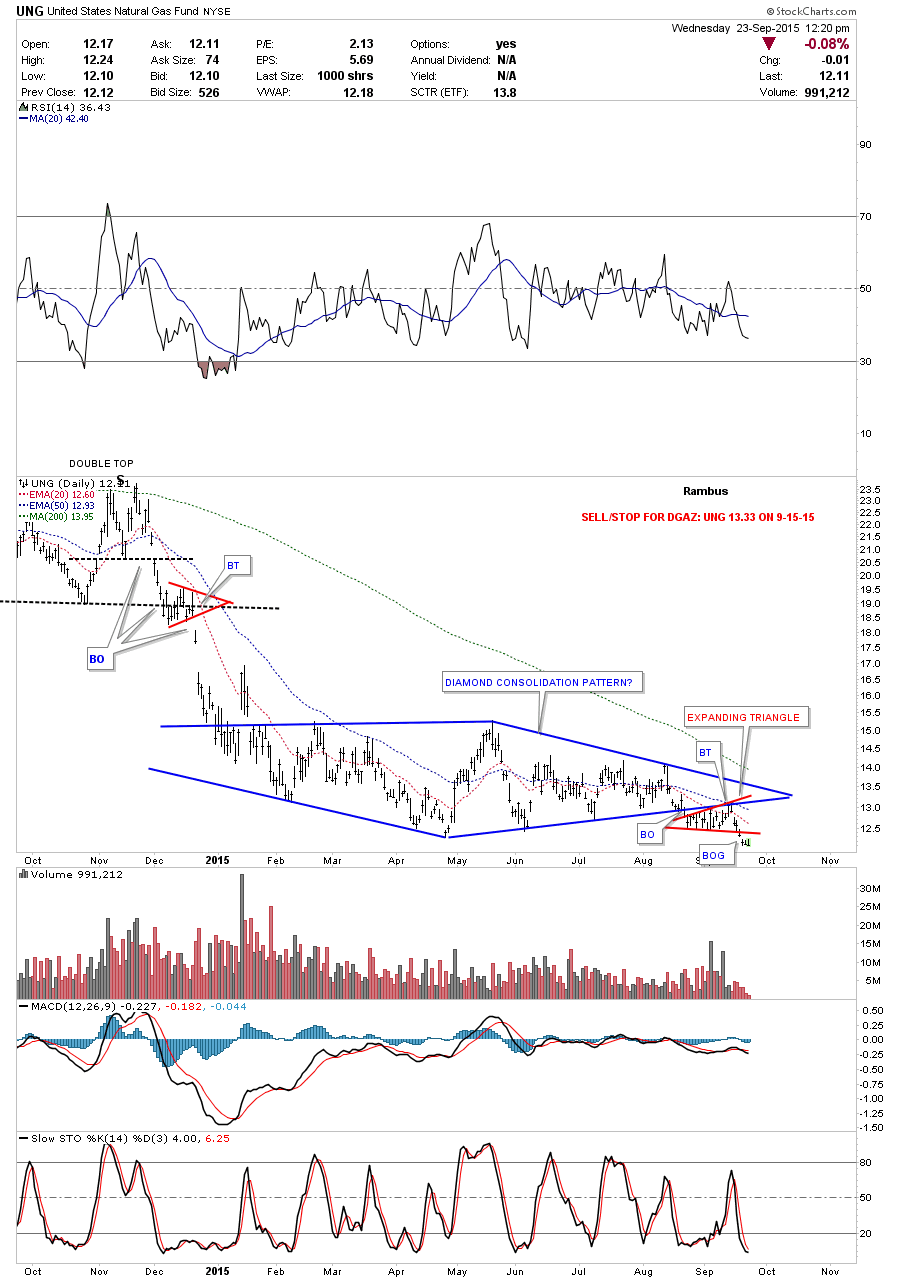
The daily chart for UNG shows the bigger Diamond consolidation pattern with the little red expanding triangle forming just below the bottom rail which is usually a bearish setup. Think of the blue Diamond as a halfway pattern to the downside. Note how the price action declined into the Diamond. We should see something similar when all the backtesting is finished and the next impulse move down begins in earnest which looks very close to beginning.
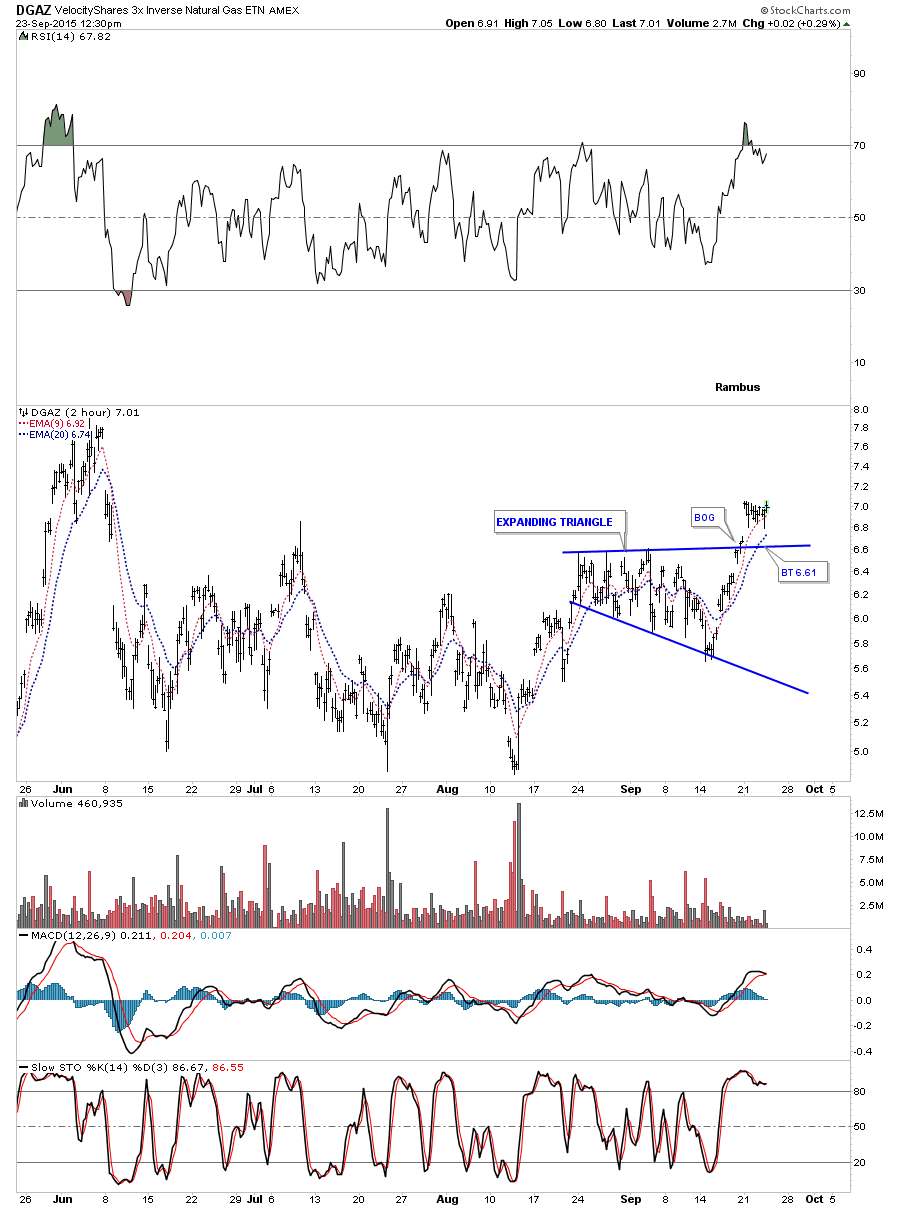
The 2 hour chart for DGAZ which is the 3 X short etf we’re trading shows its own expanding triangle with a breakout to the upside.
Below is the daily chart for DGAZ which shows the sideways trading range this etf has been in since the beginning of the year. I’m going to take my last position in DGAZ and buy another 2500 shares at the market at 7.00 using the sell/stop on the UNG if it hits 13.33 for now. KOLD is a 2 X short natural gas etf.

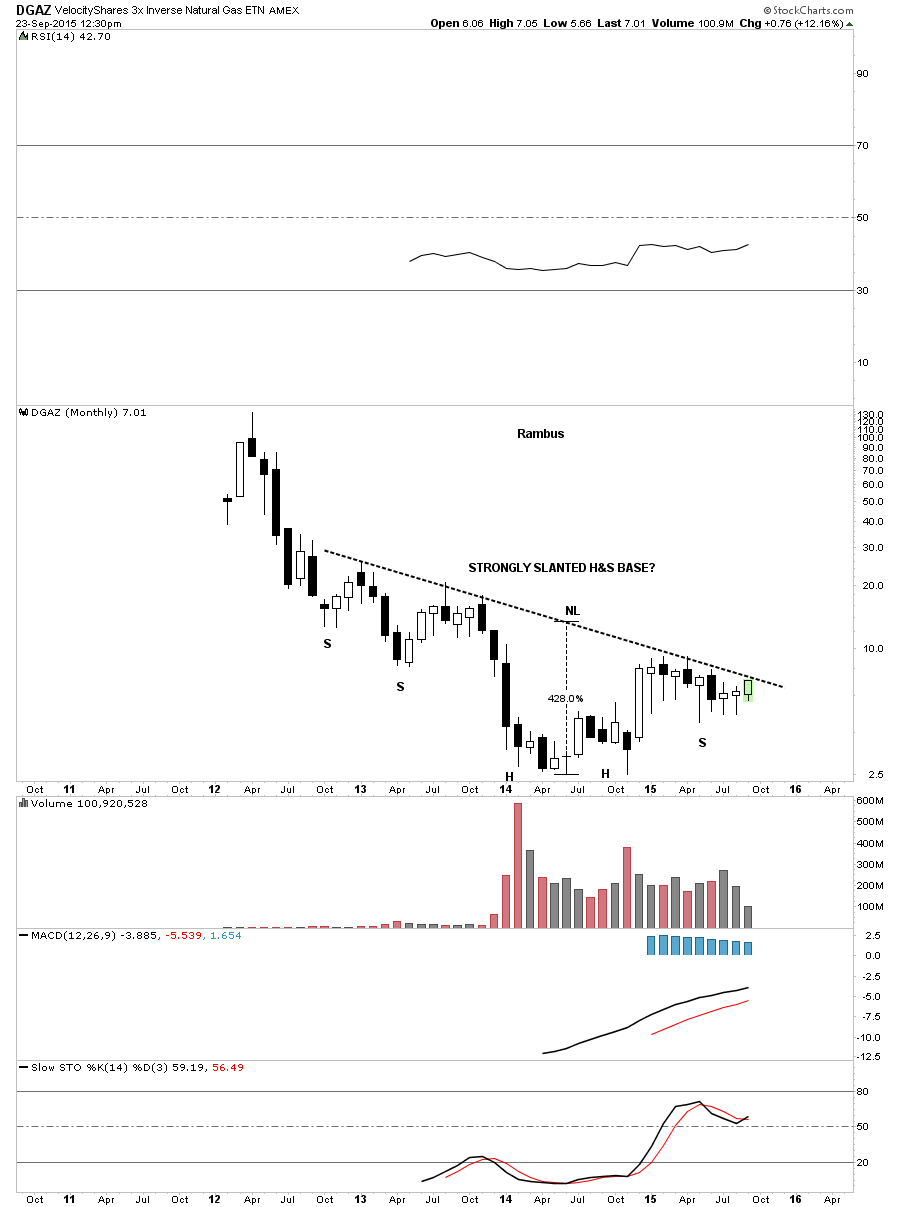
The monthly chart for DGAZ shows you why I’ve been accumulating short positions in natural gas. There is a potential very large inverse H&S bottom forming with the price action approaching the neckline. Keep in mind this is a monthly chart so things move very slowly from this perspective. With the deflationary theme in place this etf may offer some good returns.