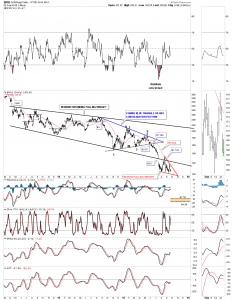
The long term daily chart below shows the massive bearish expanding falling wedge we’ve been following for well over a year now. You can see the big breakout gap that occurred in July and then the strong backtest to the bottom black trendline. I have pointed out many times when you see a smaller consolidation pattern form just above, just below, one above and one below or one right on an important trendline, which the bottom rail of the two year consolidation pattern is, is generally a bearish situation. A touch of the bottom rail of the possible red bearish falling wedge will complete the pattern. This would be a perfect setup as it would gives us a nice way to measure for a price objective. Using both measuring techniques I get a two price objectives one at 67.15 and the second just a little lower at 64.35. I don’t believe at this time that those two price objectives will mark the end of the bear market but it is a possibility that I’ll be watching very closely.
Rambus Chartology
Moving forward

