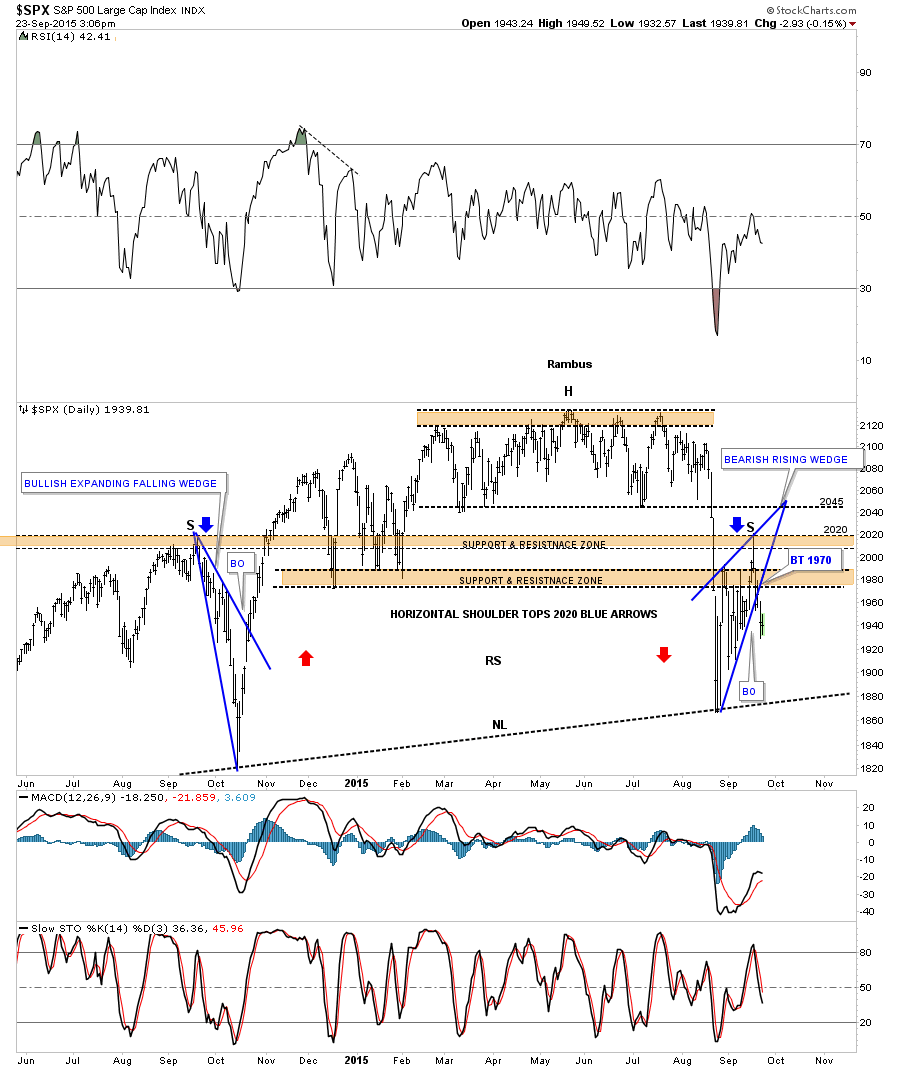
The stock markets are still in a dangerous area to try and get positioned for a move lower as many of the different stock markets have broken out from a bearish rising wedge formation since the August 24th low. This short term daily chart for the SPX shows a nice example of the rising wedge. Yesterday it broke below the bottom rail of its bearish rising wedge with today’s price action going nowhere. The top of the bearish rising wedge at reversal point #4 is the possible right shoulder high of a much bigger H&S top. A complete backtest would come in around the 1970 area.

The long term daily chart for the SPX is showing us a possible H&S top in play. The left shoulder was a bullish expanding falling wedge while the possible right shoulder is a bearish rising wedge. Breaking through the first brown shaded support and resistance zone at 2020 was a big clue that a potential H&S top maybe playing out. The reason being is that the top of the left shoulder should have held support under normal circumstances. As you can see the price action sliced right through the left shoulder high like a hot knife through butter. That was the very first thing we needed to see if a H&S pattern was going to form. Next we got the initial bounce that took the SPX backup to the lows that formed on the left side of the chart at the 1985 area. After bouncing off of the bottom rail of the blue rising wedge the SPX made another run higher but this time it found resistance at the 2020 area. This is a similar setup I was looking for on the oil chart where the tops of the left and right shoulders form at the exact same height even tho the neckline is slanted. Note how the brown shaded S&R zones held initial resistance at 1985 after the big selloff. The lower S&R zone was hit and the SPX fell lower followed by a second hit which this time broke through to find resistance at the next brown shaded S&R zone at 2020. The only S&R zone that hasn’t been tested is the one at 2045 which I’m viewing as the head portion of the big H&S top. Again getting positioned in this type of volatility can be very hard. You can be right but still wrong if the move is delayed or there is a whipsaw. If we get a backtest to the underside of the rising wedge at the 1970 area I will take a short position.