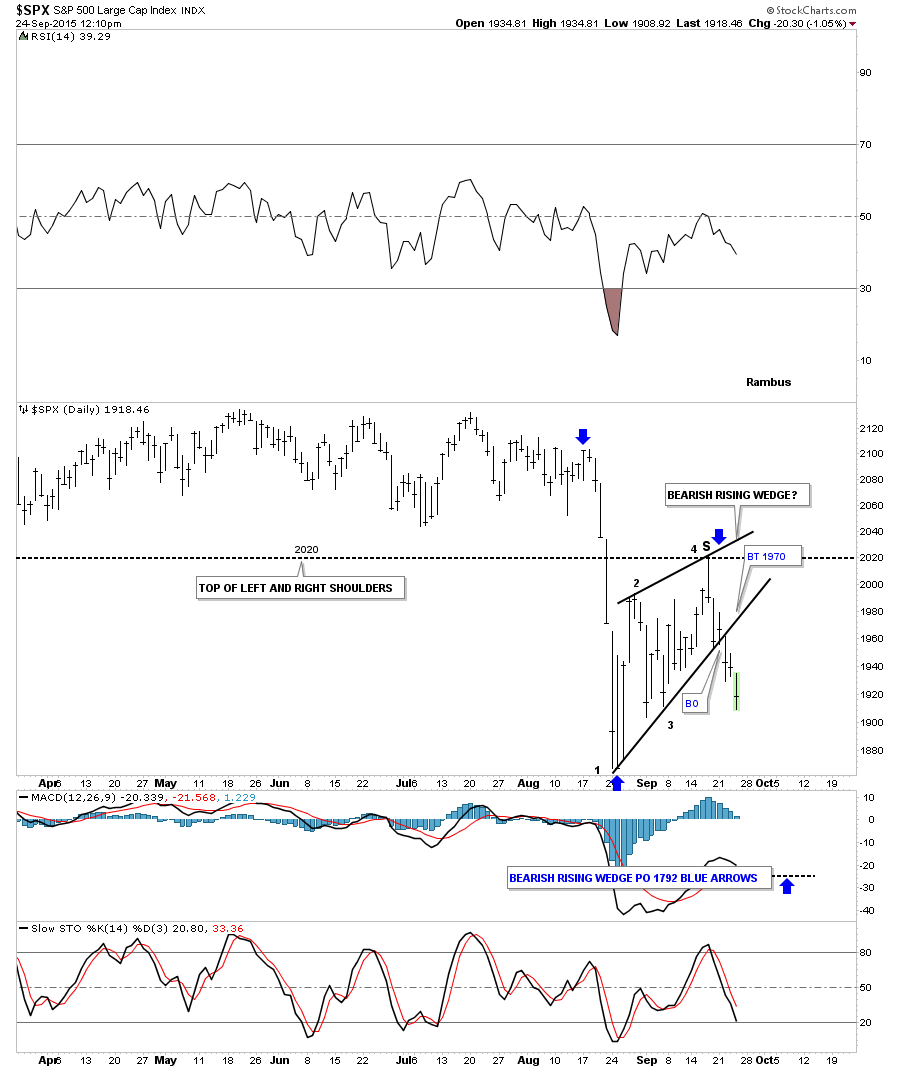
Below is the daily chart for the SPX we looked at yesterday which shows the bearish rising wedge. If the bearish rising wedge plays out as a halfway pattern the price objective would be down to the 1792 area. That would also mean the neckline would be broken on the potential big H&S top.
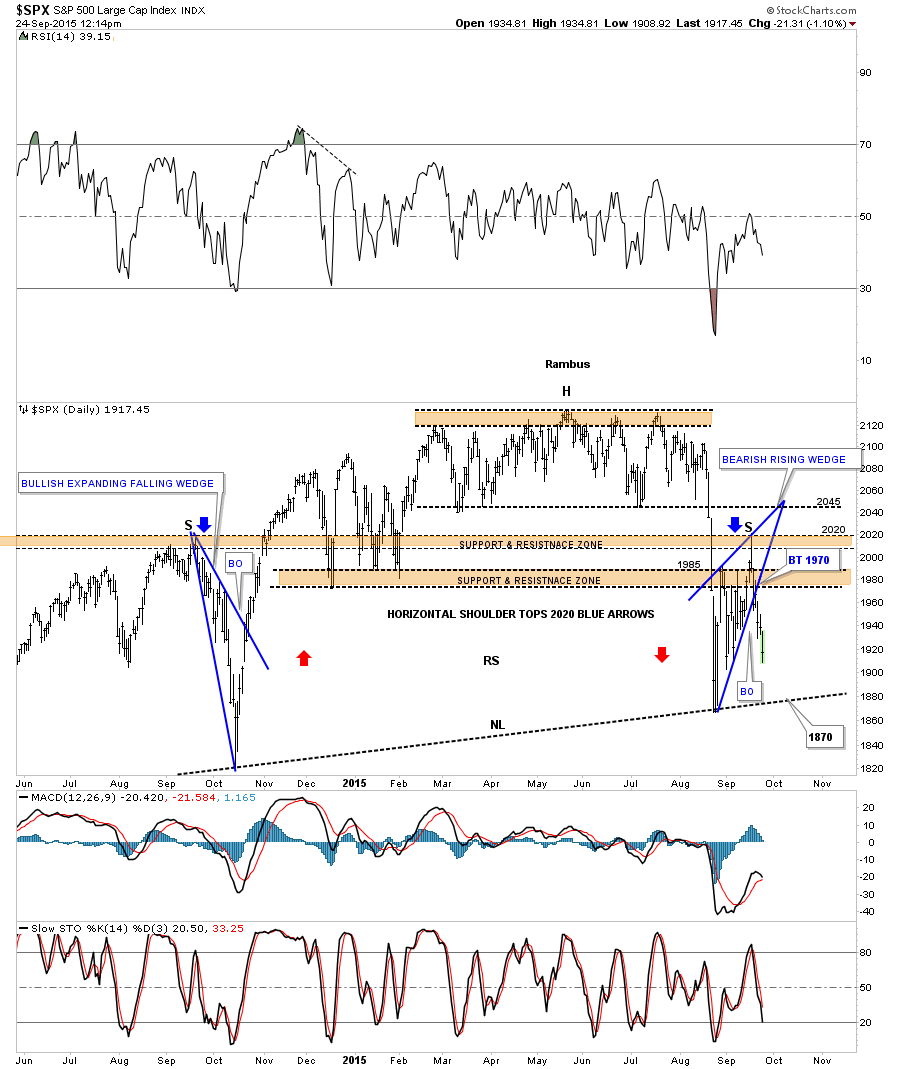
The next chart for the SPX we also looked at yesterday which shows the potential neckline coming into play around the 1870 area.