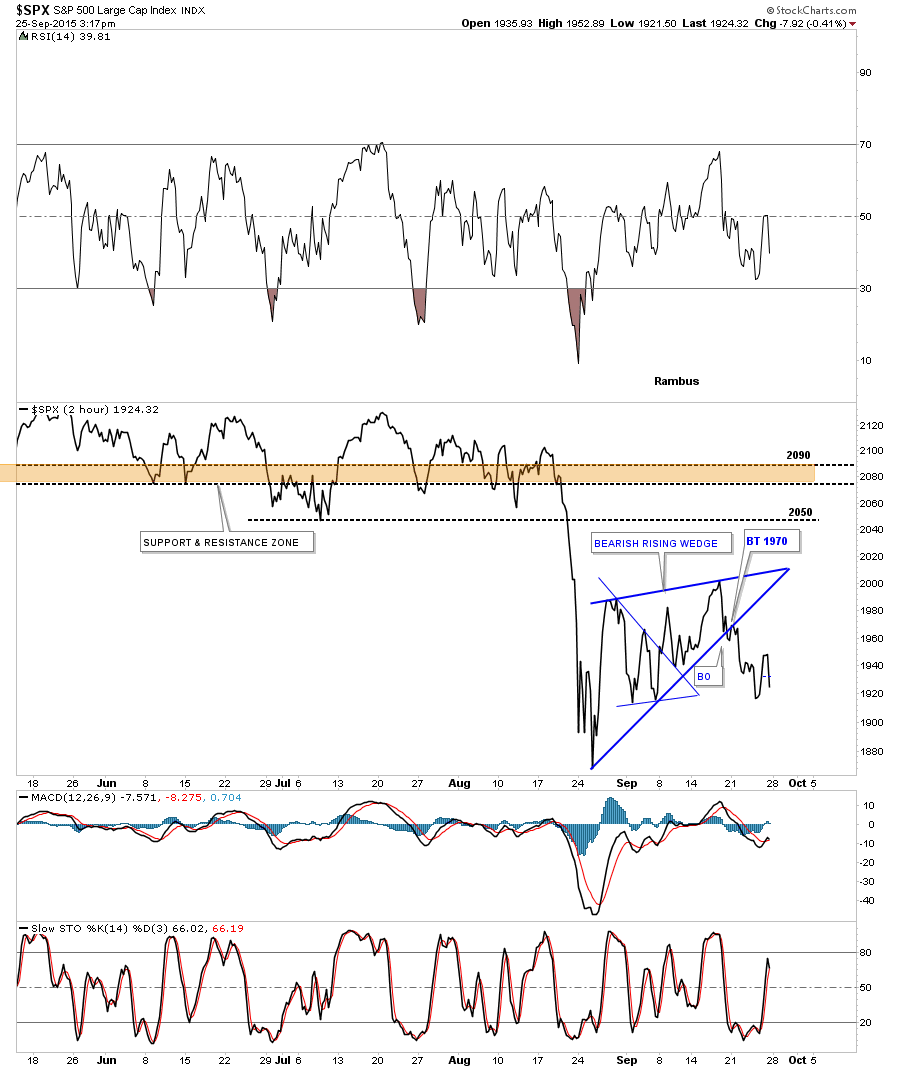
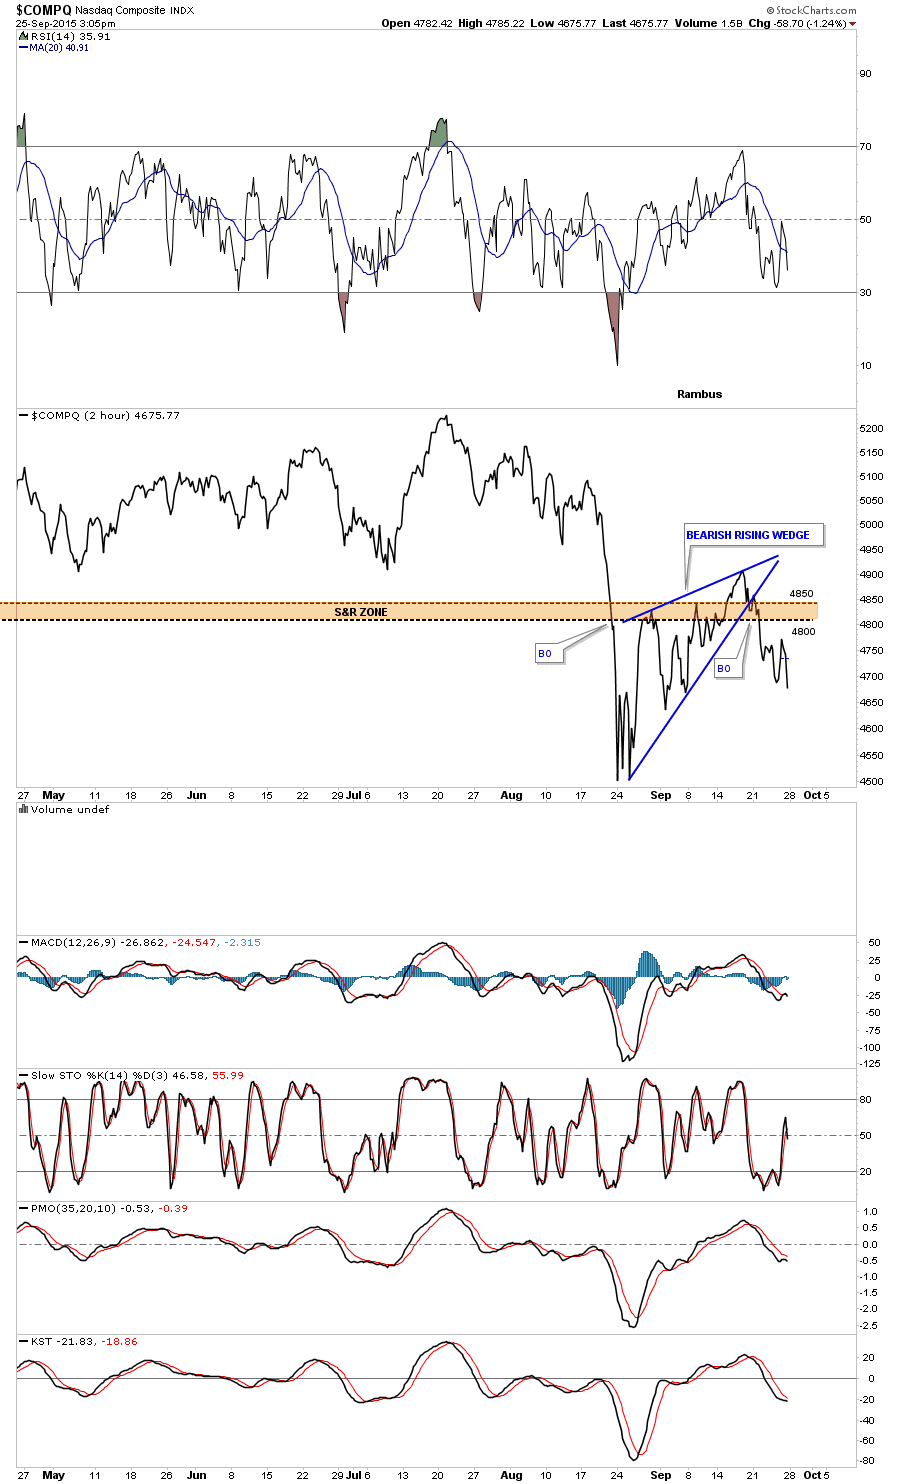
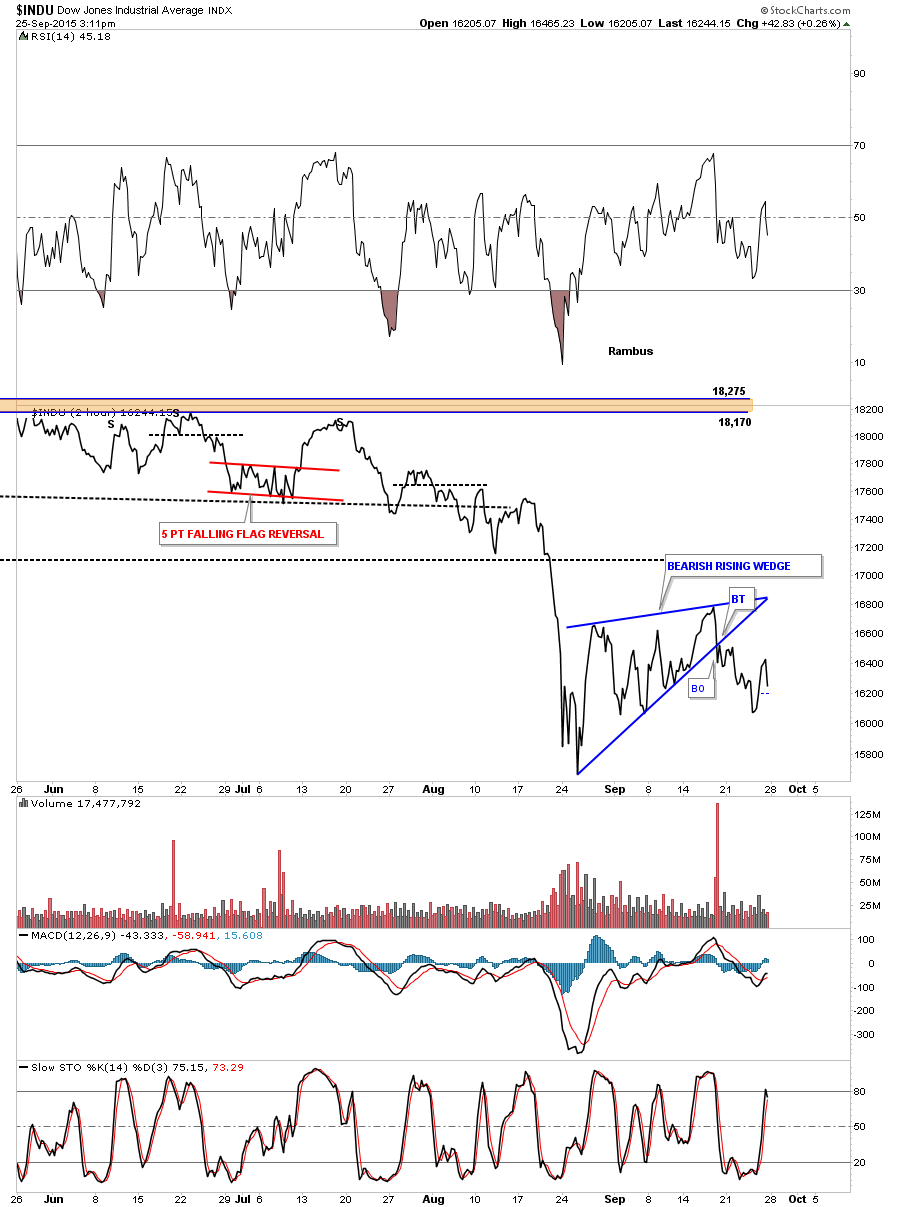
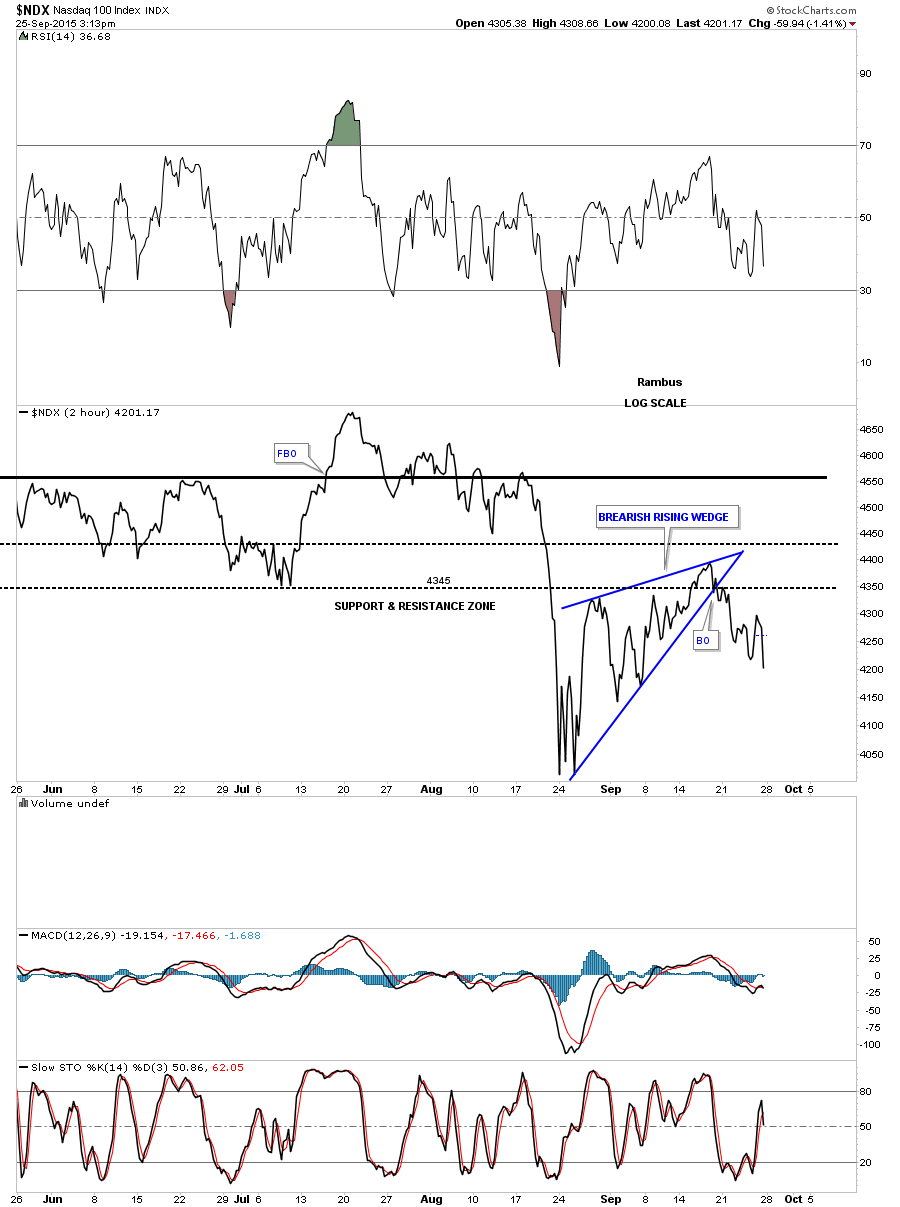
Below are some 2 hour line chart for some of the US stock markets. Most have a bearish rising wedge which have broken below their bottom trendlines. Where the first reversal point begins, at the August low, is the minimum price objective these bearish rising wedges should achieve. Some of these rising wedge may also be the right shoulder of a big H&S topping pattern.
The COMPQ 2 hour.
INDU 2 hour chart.
NDX 2 hour chart.
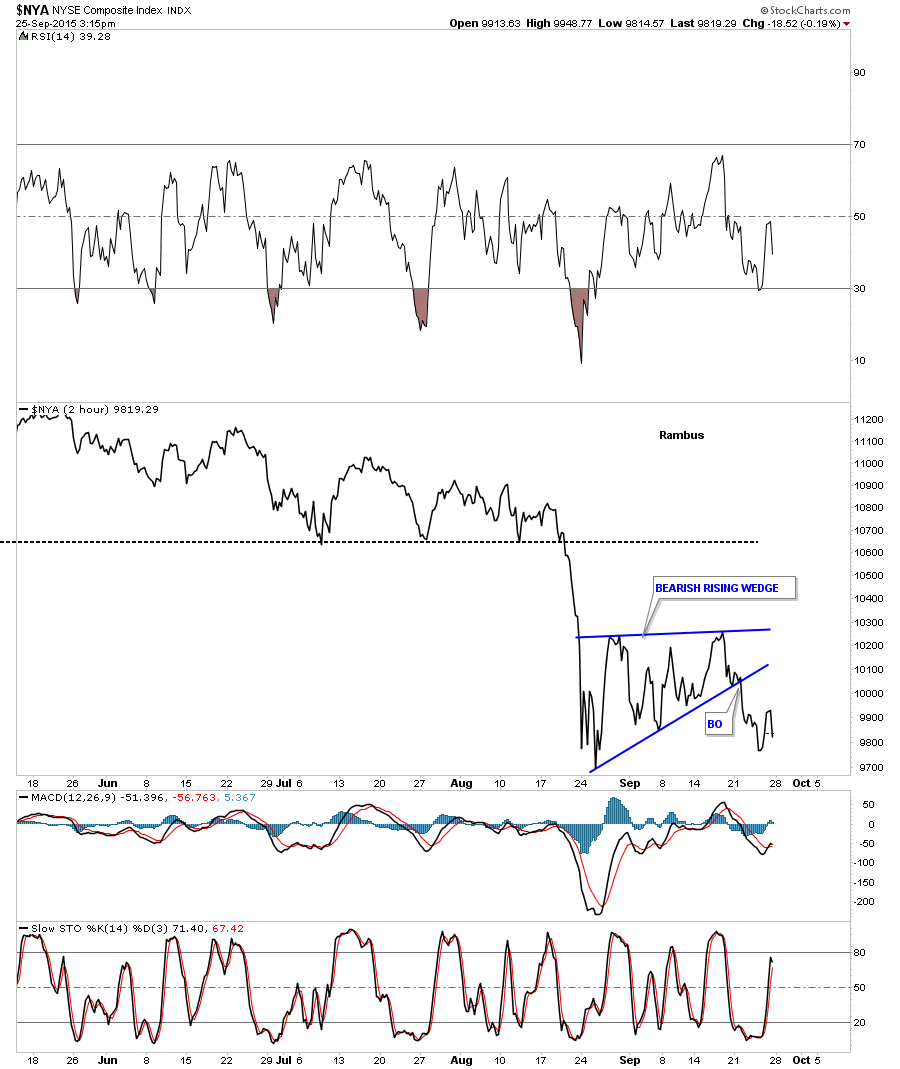
NYA 2 hour chart.
SPX 2 hour chart.