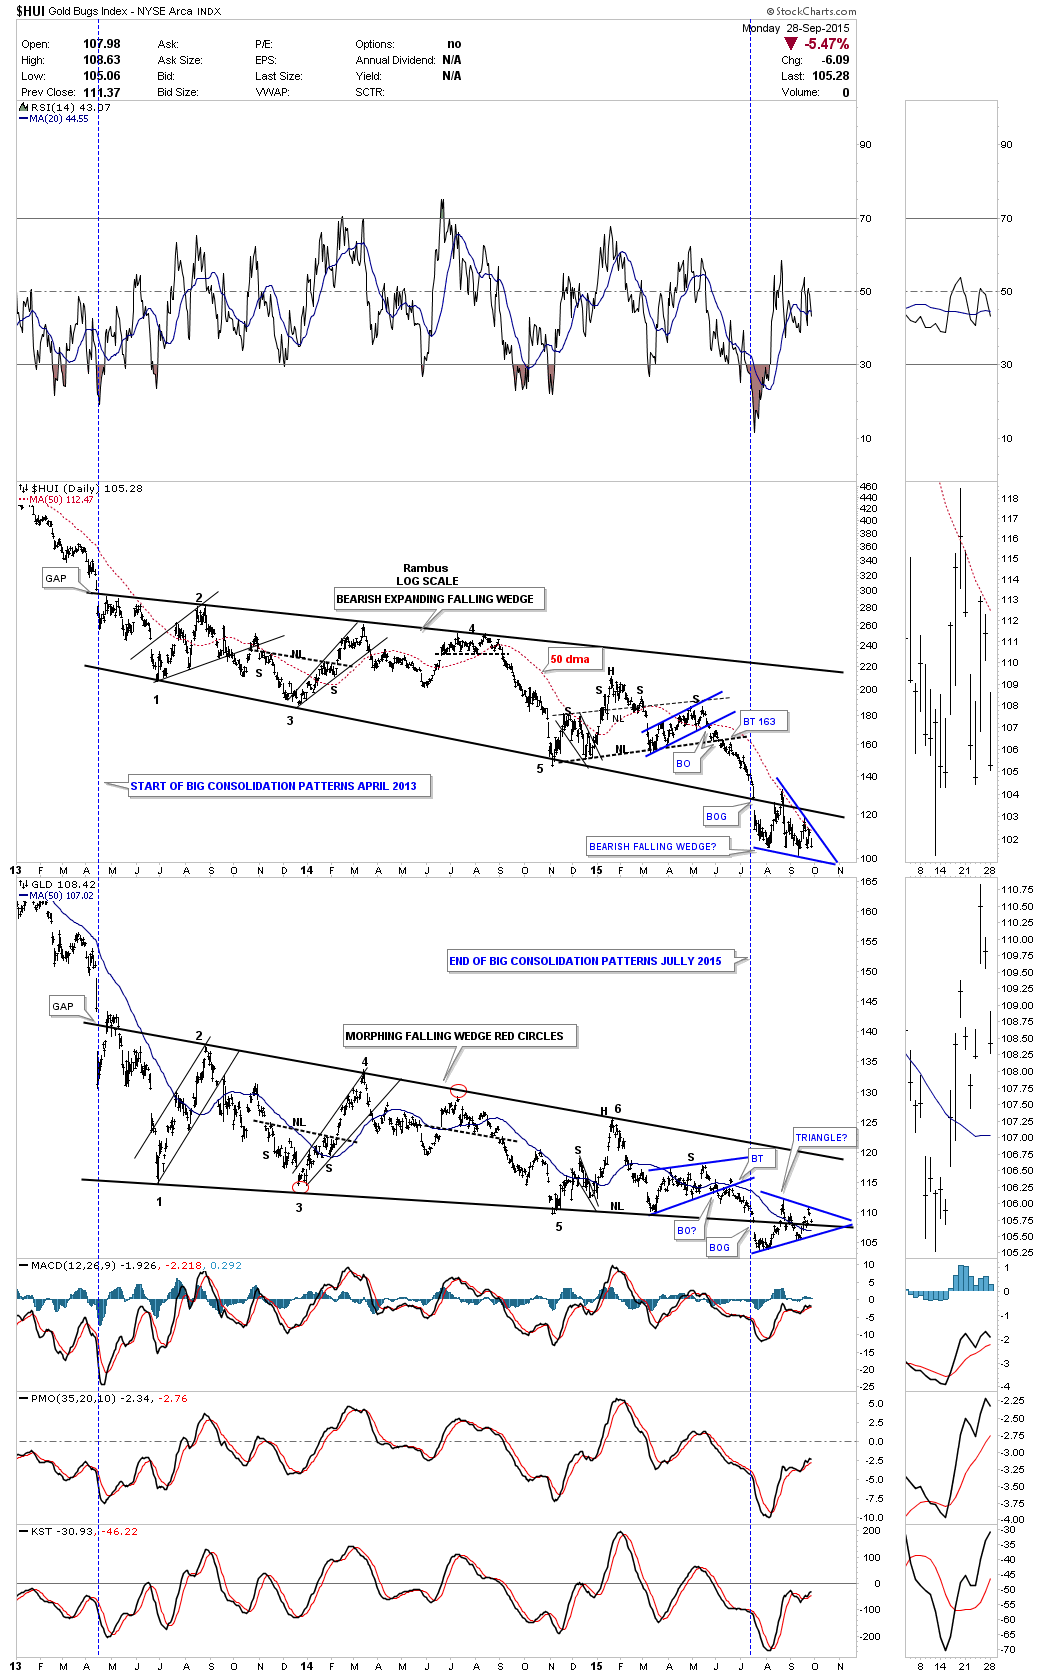
Below is the combo chart we’ve been following very closely that has the HUI on top and GLD on the bottom. This charts shows the big 2 plus year consolidation patterns for each stock. On the left side of the chart you can see how they both began building out their big consolidation patterns with a big gap down in April of 2013. Then they both broke below their respective bottom rails in July of this year also with a huge breakout gap. Since the big breakout in July of this year they both have been forming smaller consolidation patterns at their breakout points. As the HUI has been weaker than GLD it’s forming a small blue bearish falling wedge just below the bottom rail of its 2 plus year consolidation pattern. GLD on the other hand has been stronger and is forming a blue triangle consolidation pattern right on its bottom trendline of its 2 plus year consolidation pattern. They’re both working on their fourth reversal point within their small blue consolidation patterns. It wouldn’t surprise me if we see them both break below their bottom blue rails on the same day which will be confirmation that the next impulse move down is truly beginning. It has been a long time coming but we’re ever so close.