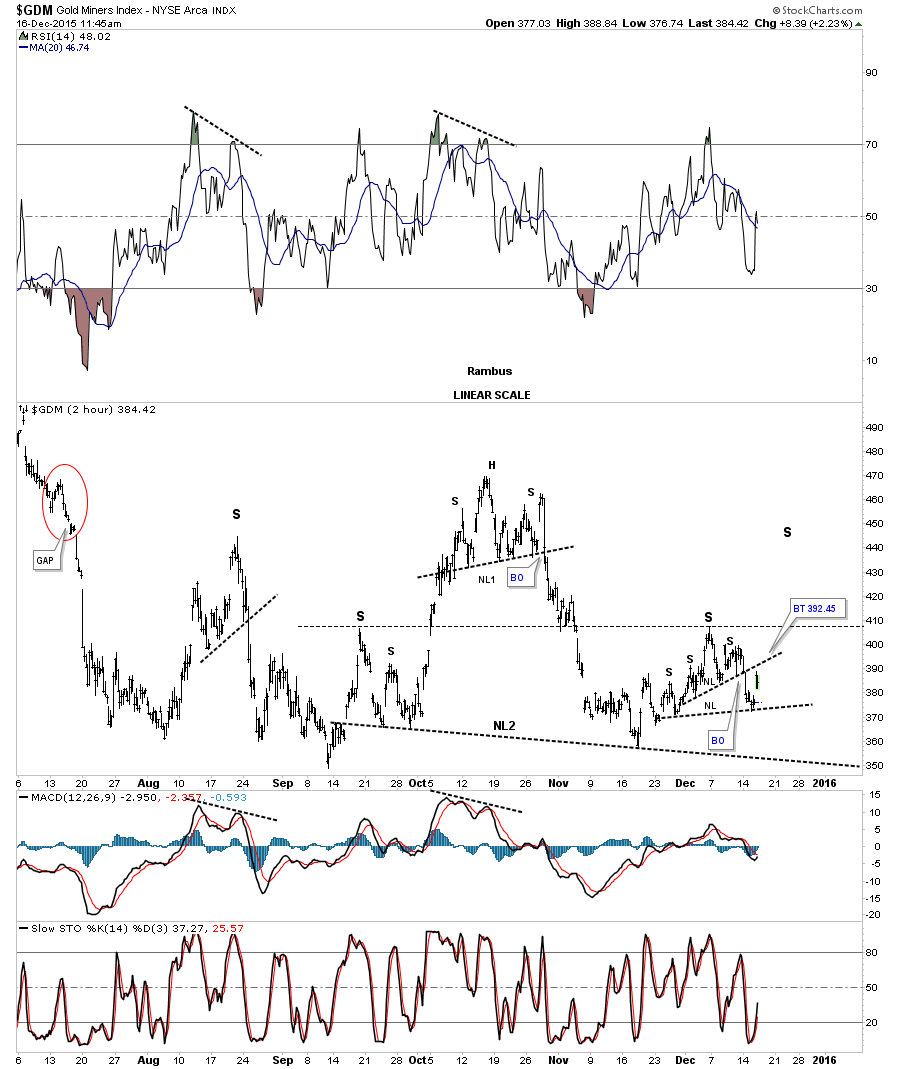
Below is the 2 hour chart which is showing the possible right shoulder forming as part of the reverse symmetry from the left side of the chart. A backtest to the small H&S neckline would come in around the 392.45 area. That backtest could be forming a second small right shoulder. With the fed news today we could see some wild price action for a half hour or so before things settle down.
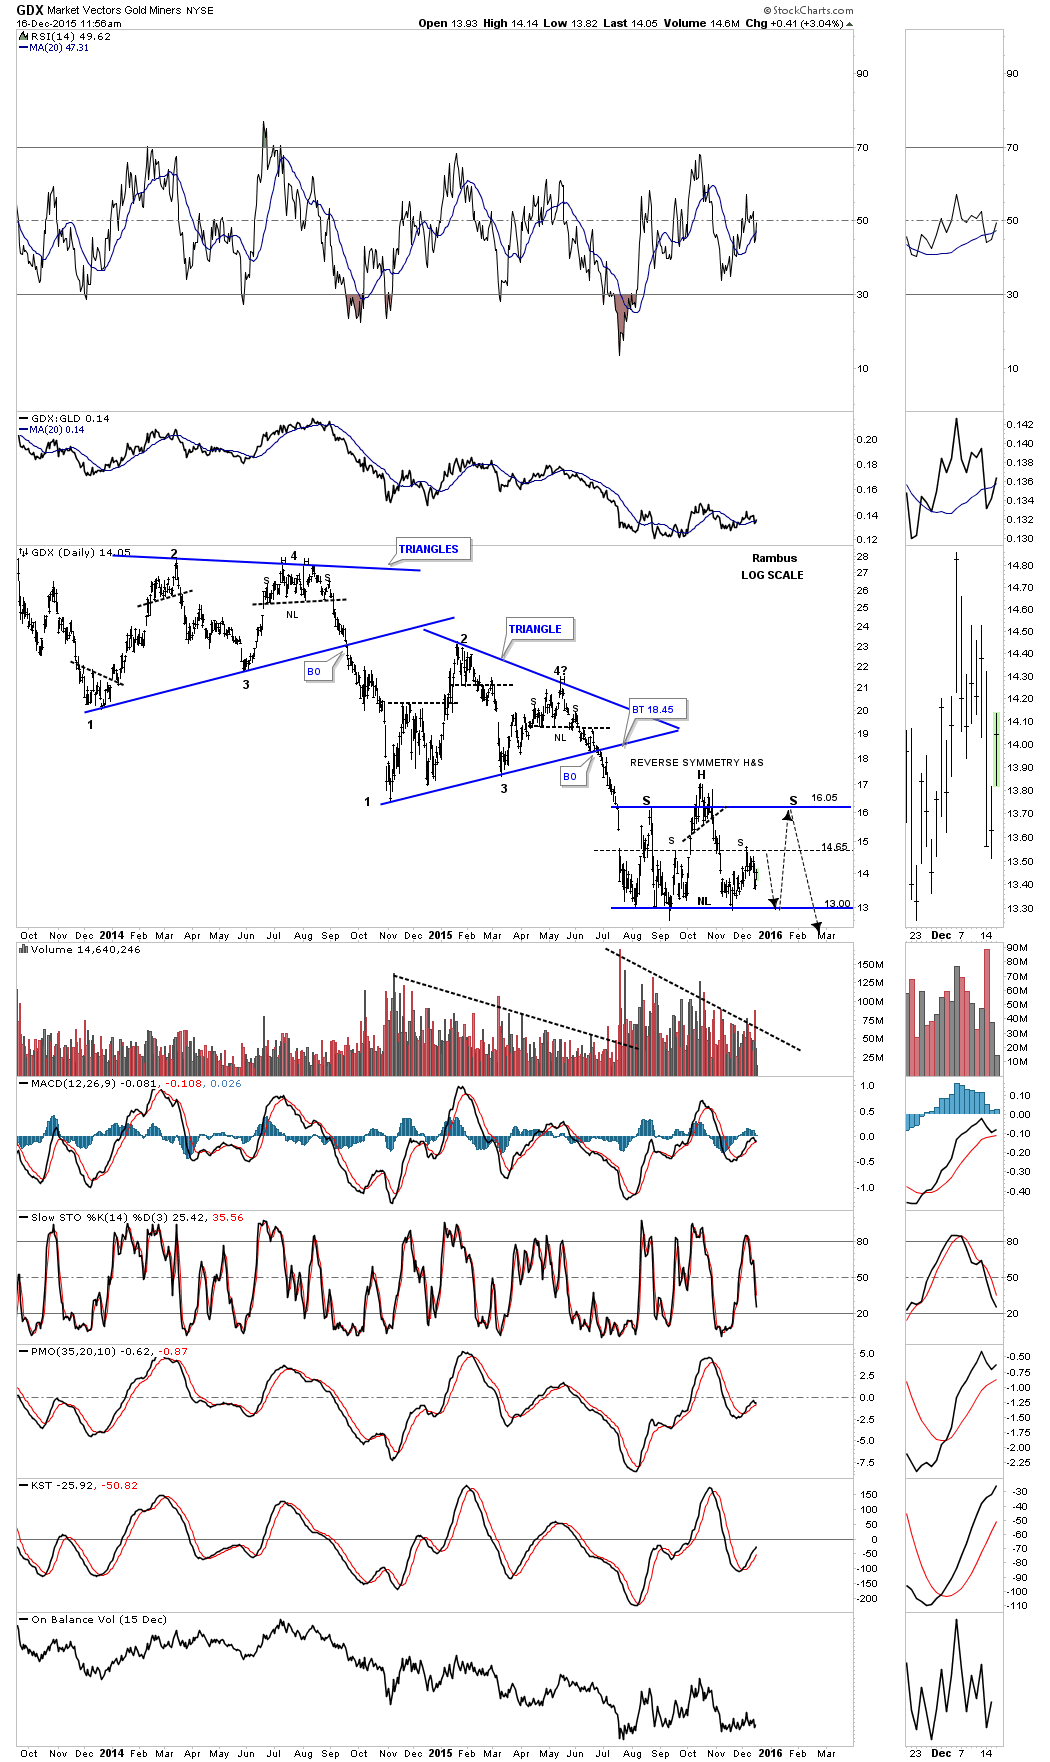
Below is the daily chart for the GDX which shows you what reverse symmetry would look like in a perfect world, black arrows.