Before we look at a bunch more PM stocks tonight I would like to say something about the Kamikaze Stocks. First when I take a position in one of the Kamikaze stocks it’s based on the underlying index. For instance when I take a position long or short in the juniors it’s based on the GDXJ. For the big cap miners it’s based on one of the big cap PM stock indexes such as GDM, HUI or the GDX. The same goes for gold and silver. Believe me I’m fully aware of the depreciating aspect these Kamikaze stocks have over the longer period of time. Some may think it’s a total waste of time looking at the Kamikaze stock but they can gives us some good clues based on their own individually chart patterns.
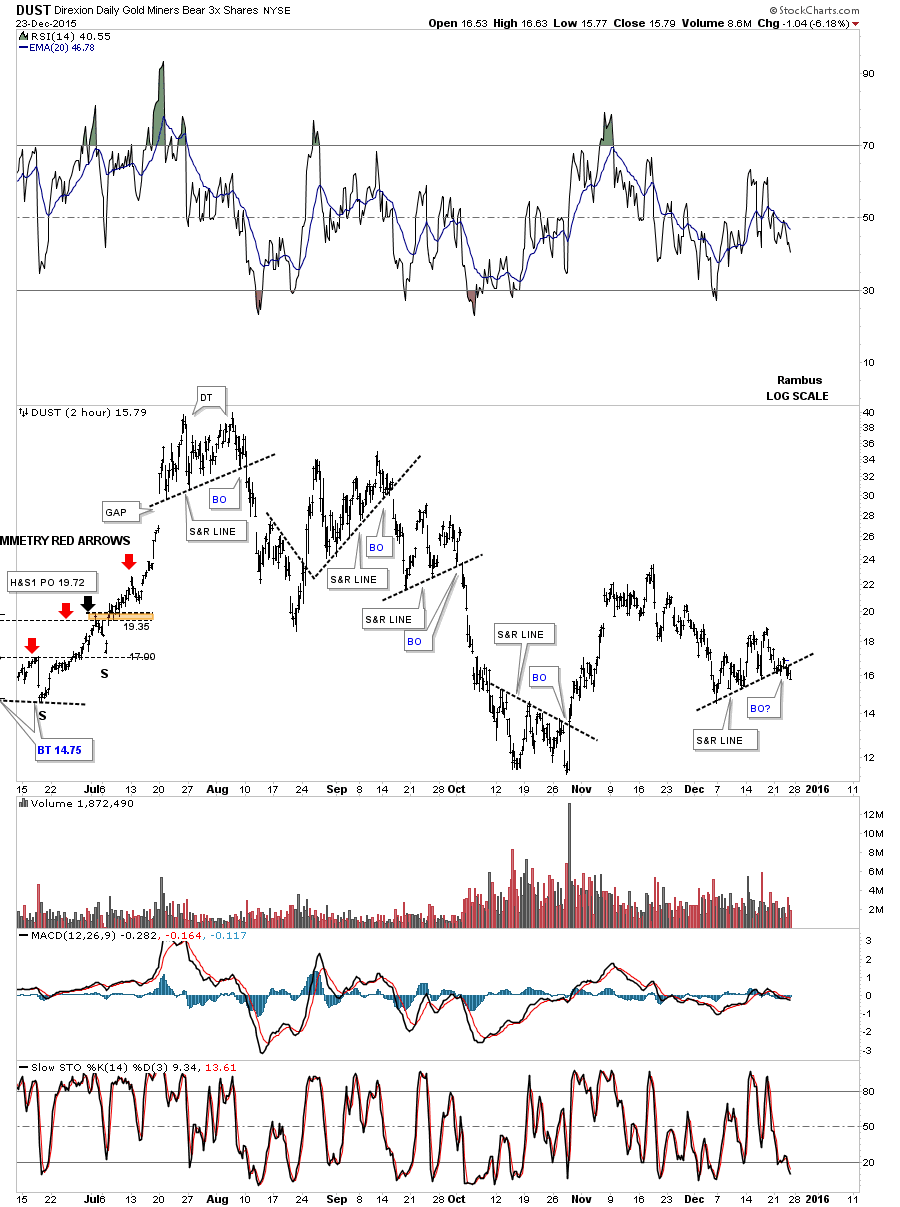
Let me show you an example of what I mean. Below is a 2 hour chart for DUST going back to July of this year. The first thing I would like you to note are the black dashed support and resistance lines. One thing I learned the hard way is to respect those black dashed S&R lines because when they get broken a big move generally occurs. Sometimes waiting a day or two to pull the trigger can cost you dearly. Up until today our current black dashed S&R was still holding support which I also showed you on the HUI chart earlier today which was holding resistance. DUST was probably about four hour or so ahead of the HUI in respect to the black dashed trendline. When I seen DUST cracking its black dashed S&R line it put me on high alert to keep a close eye on the HUI’s trendline. Knowing what can happen when one of these S&R lines gives way it was time to exit the DUST trade right or wrong.
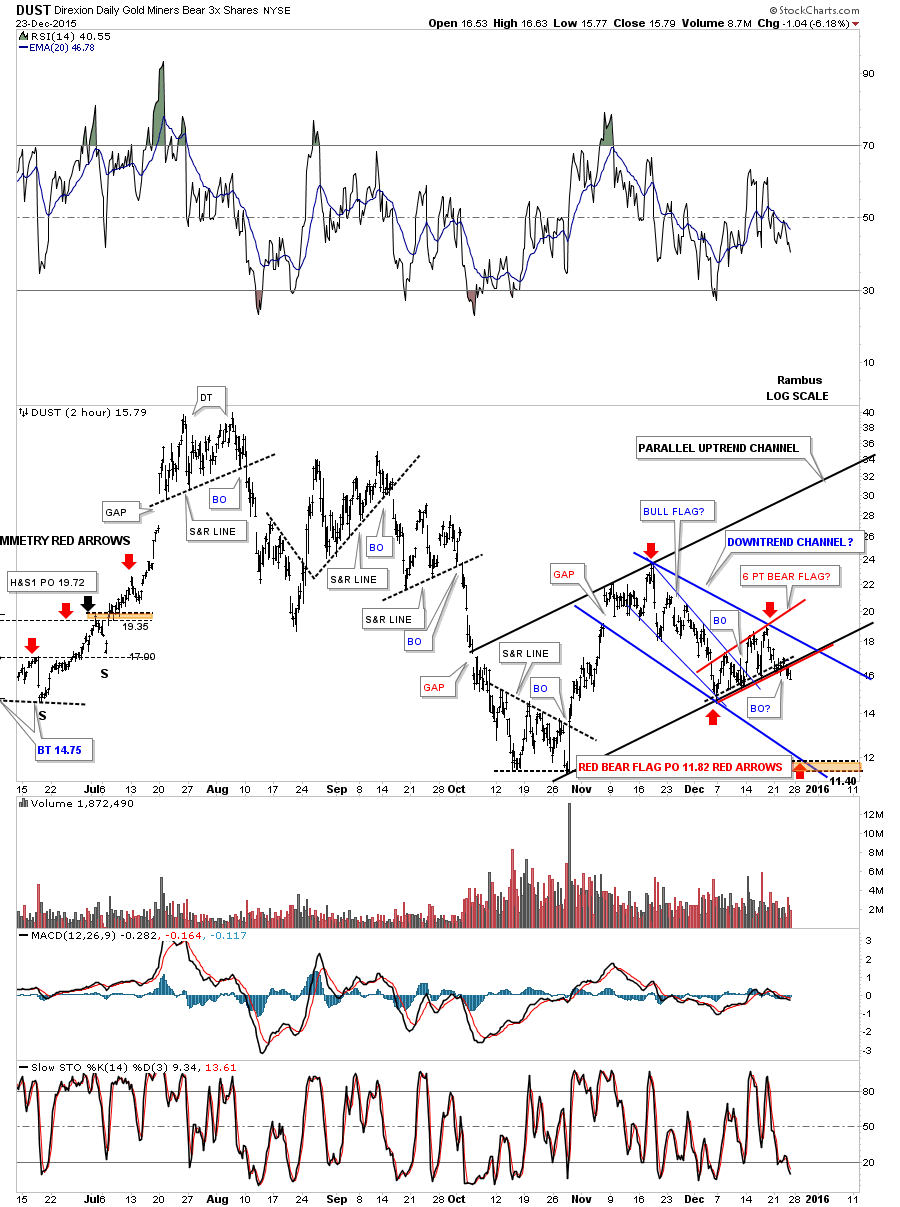
Next I would like to add some Chartology to the same 2 hour chart for DUST to show you why today was time for me to exit this trade. Generally when I draw in a top rail of a rising channel I like to look for a gap first and then if there is no gap a previous small high or low to start the trendline. DUST had formed a nice gap on the way down so that’s where I started the top trendline of what had been a pretty good looking parallel uptrend channel. As you can see the bottom parallel trendline held support on five separate touches which makes it very important. The price action cracked the bottom black rail of the uptrend channel today which is something I didn’t want to see because of the possible consequences that may transpire.
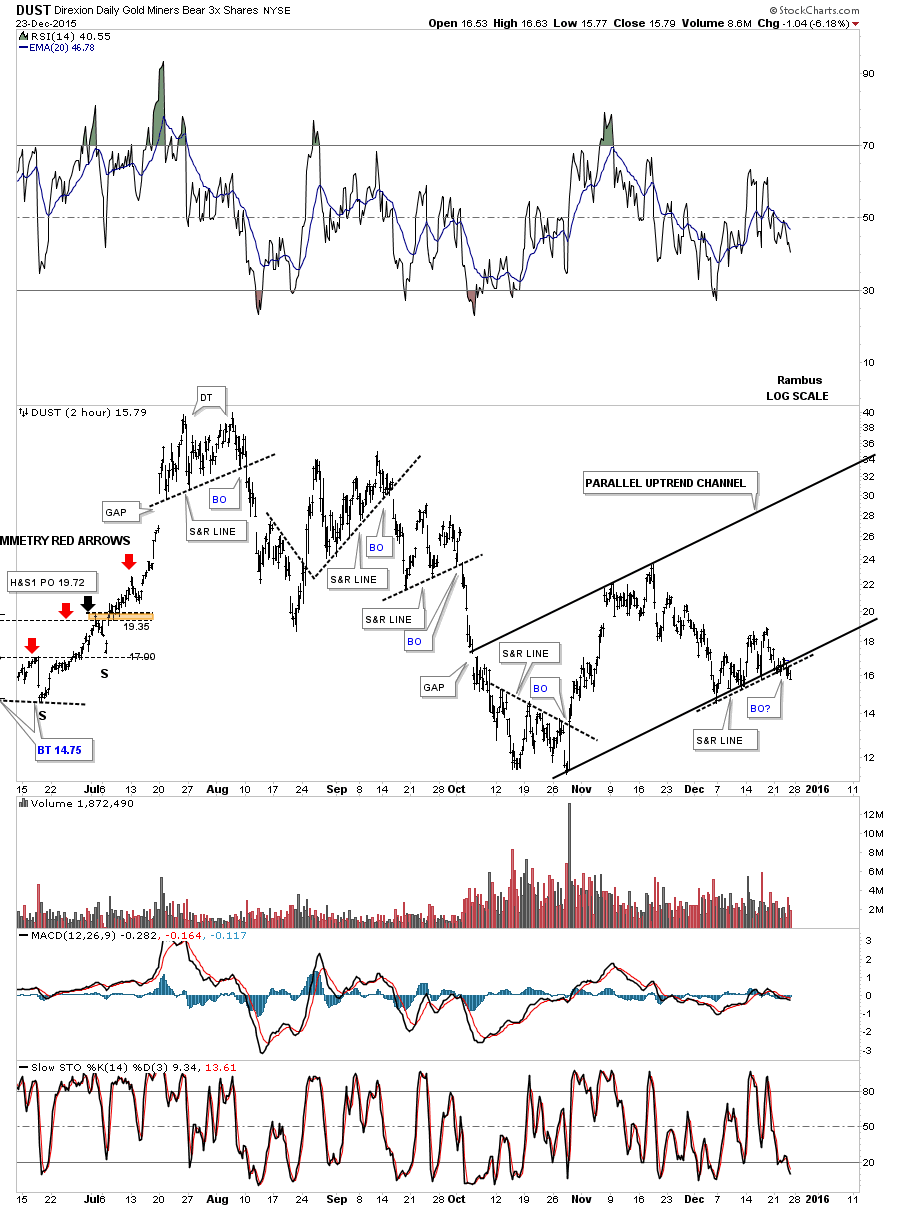
Until today’s crack of the bottom trendline the corrective decline that began around the 10th of November looked just like a normal correction within an uptrend channel. After finding support at the bottom black trendline DUST broke above the top rail of the blue downtrend channel and began what looked like the next impulse move higher. After a short rally DUST declined again and found support once more on the bottom rail of the black uptrend channel. A second rally attempt was made but it ran out of gas at the previous little high and rolled over testing the bottom black rail of the uptrend channel again. When you’re looking for a strong impulse move, that’s what you want to see, a strong move. Note the strong impulse move in late October of this year that started the uptrend channel.
Here you can see DUST was hesitating and not showing the stuff of a strong impulse move which throws up a red flag to keep a close eye on things. Actually up until today DUST was finding support exactly where I wanted to see it but with the failure to really launch an impulse move it demanded my close attention.
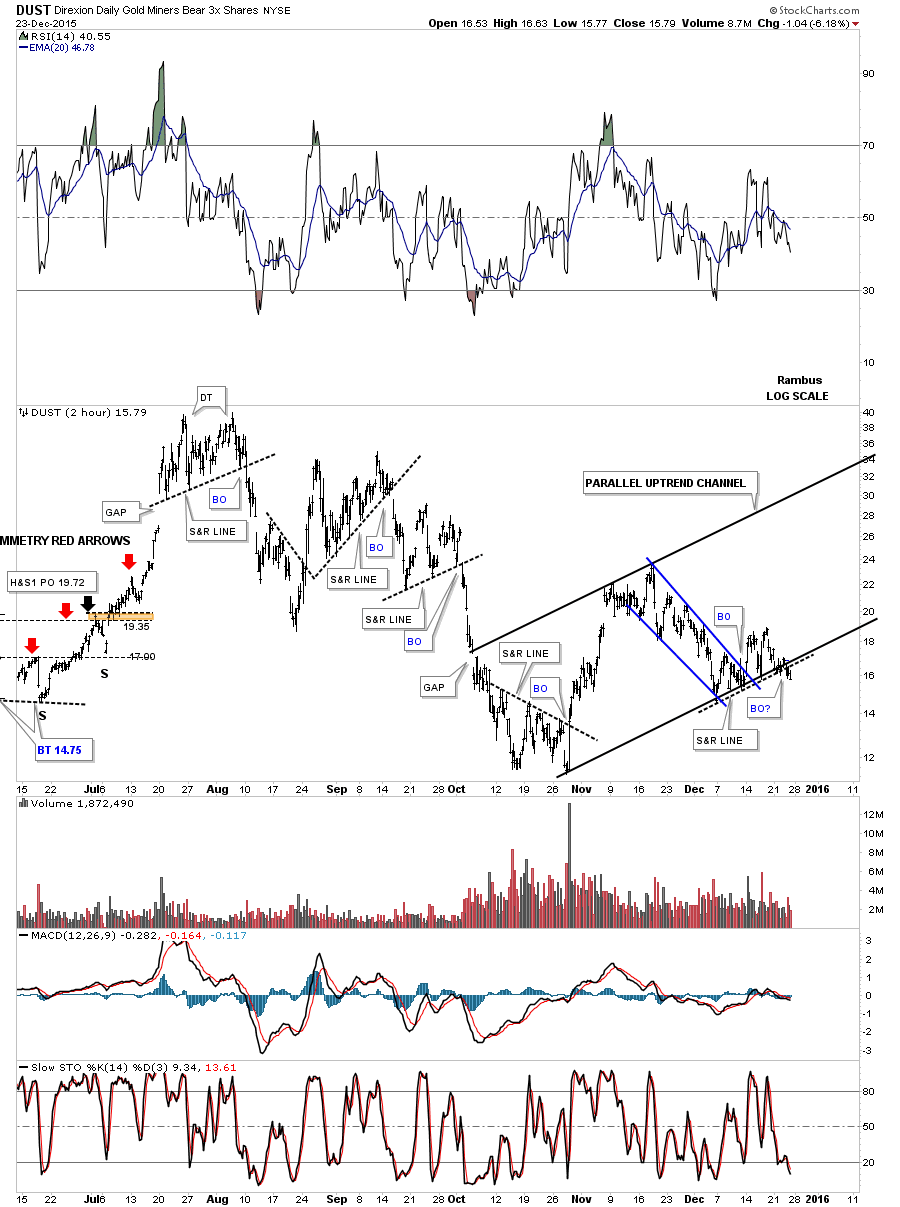
This last chart for DUST now shows you why I had to exit this trade today. Instead of the black parallel uptrend channel with the blue bull flag as the halfway pattern we now may very well have made a six point red bear flag sitting in the middle of the blue downtrend channel. So today’s break of the initial black dashed S&R rail we looked at on the first chart above, the break of the bottom rail of the black uptrend channel and now the breakout of a possible 6 point red bear flag tells me today’s crack is very important and not to be taken it lightly.
Some may think the failure of this trade to workout is a done deal. Sometimes the picture becomes much more clearer when you see a failure like this which now opens up the door for another trade with more clarity. I’ve added the red arrows which shows a price objective down to the October lows around the 11.50 area as shown by the brown shaded price objective zone using the red bear flag as a halfway pattern. Tomorrow is a new day with new opportunities if we can keep an open mind. I’ll have more later on tonight in Part 2 of the PM stocks. All the best…Rambus
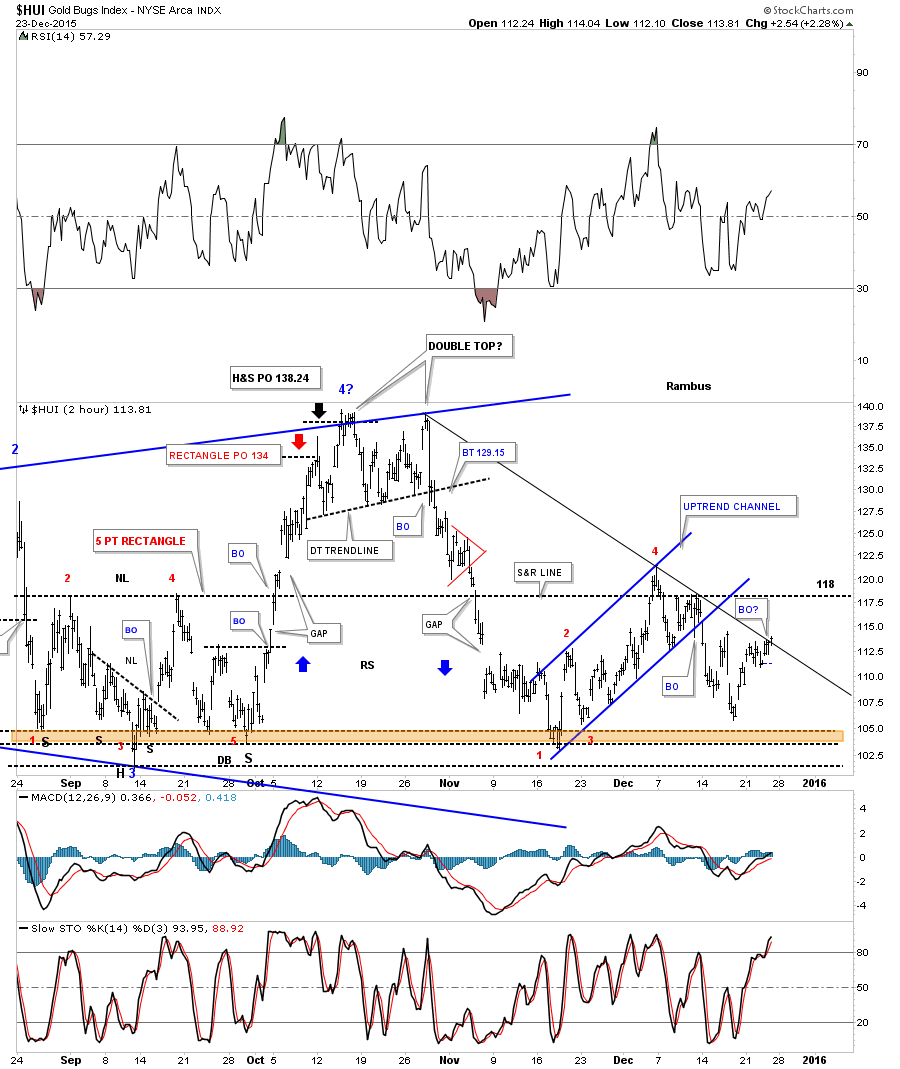
HUI 2 hour chart. Is the top rail just cracked or has the HUI broken out above it? Tomorrow we should know the answer to that question.