
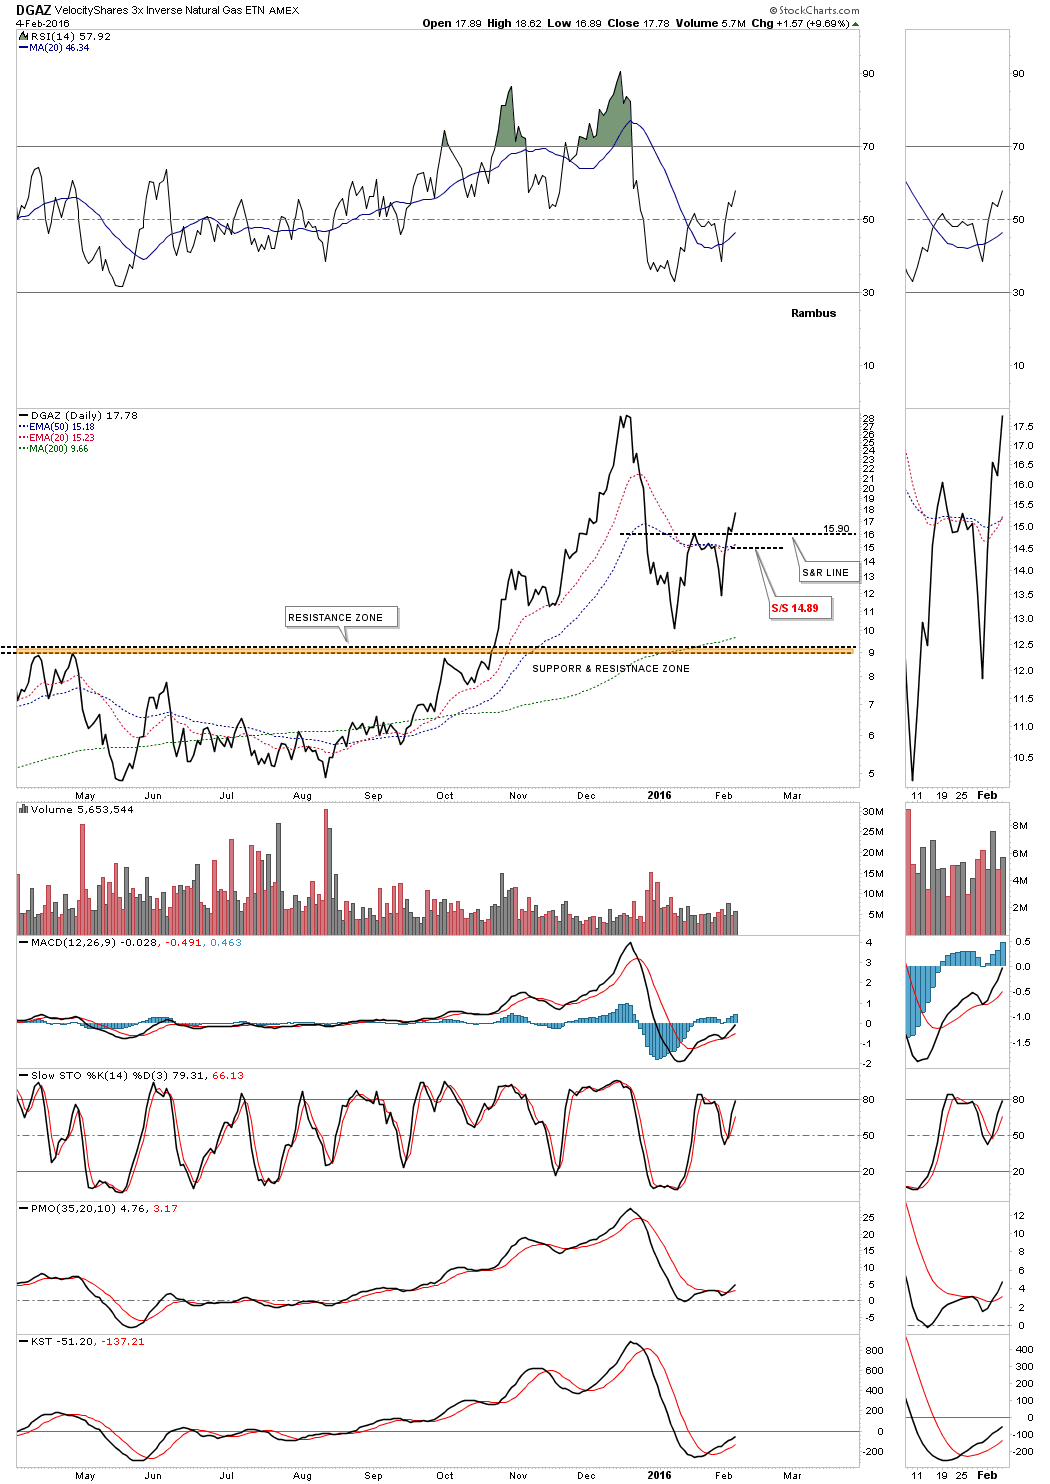
DGAZ 2-4-16. I’m going to place a sell/stop at 14.89 just below the S&R line and the 50 and 20 ema’s on the daily line chart.
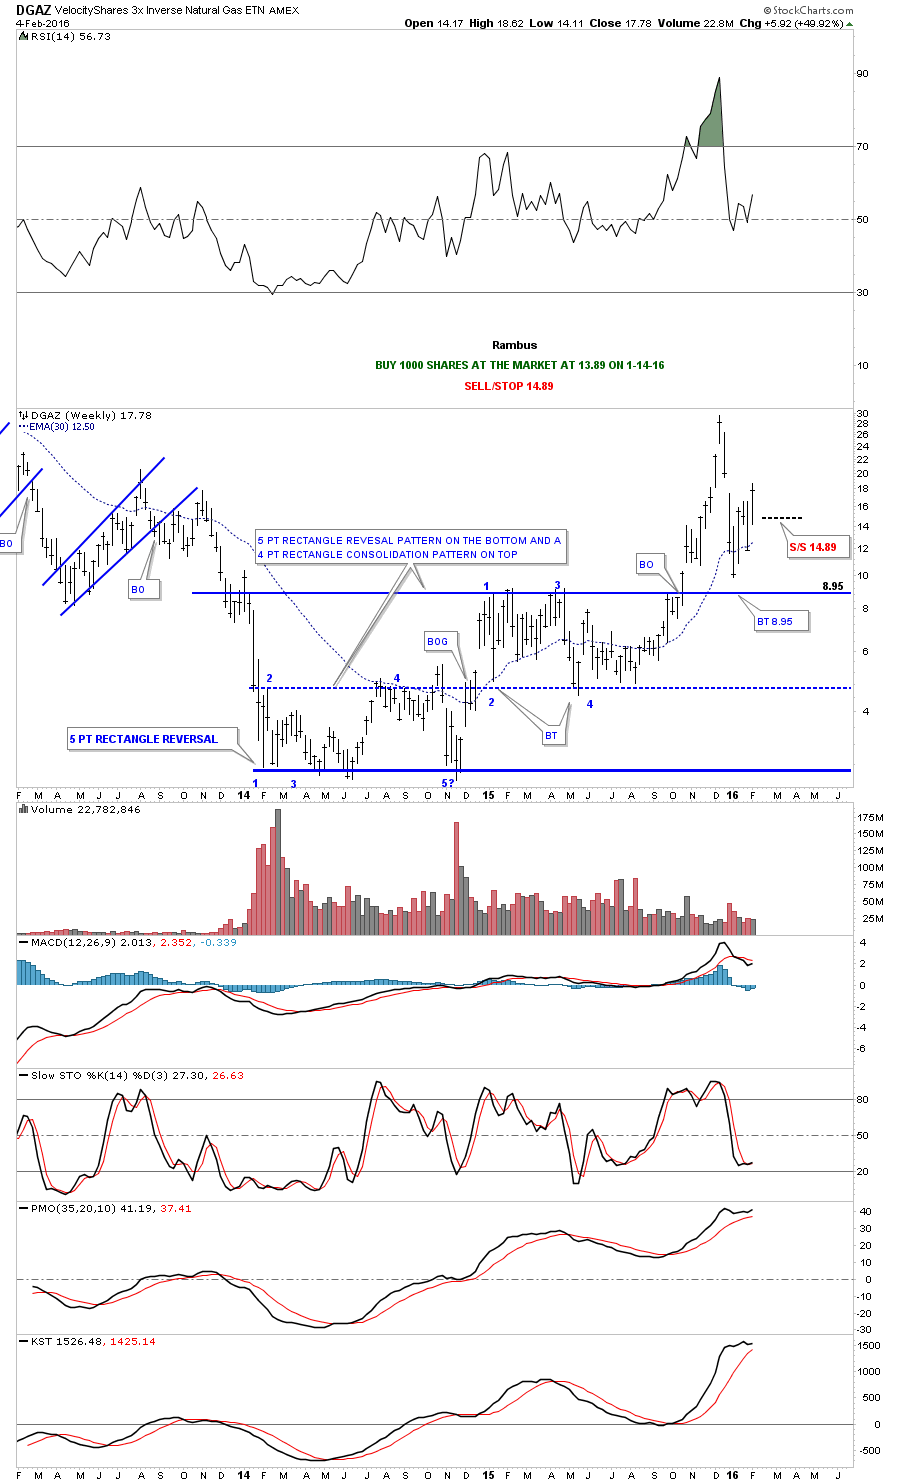
DGAZ weekly:
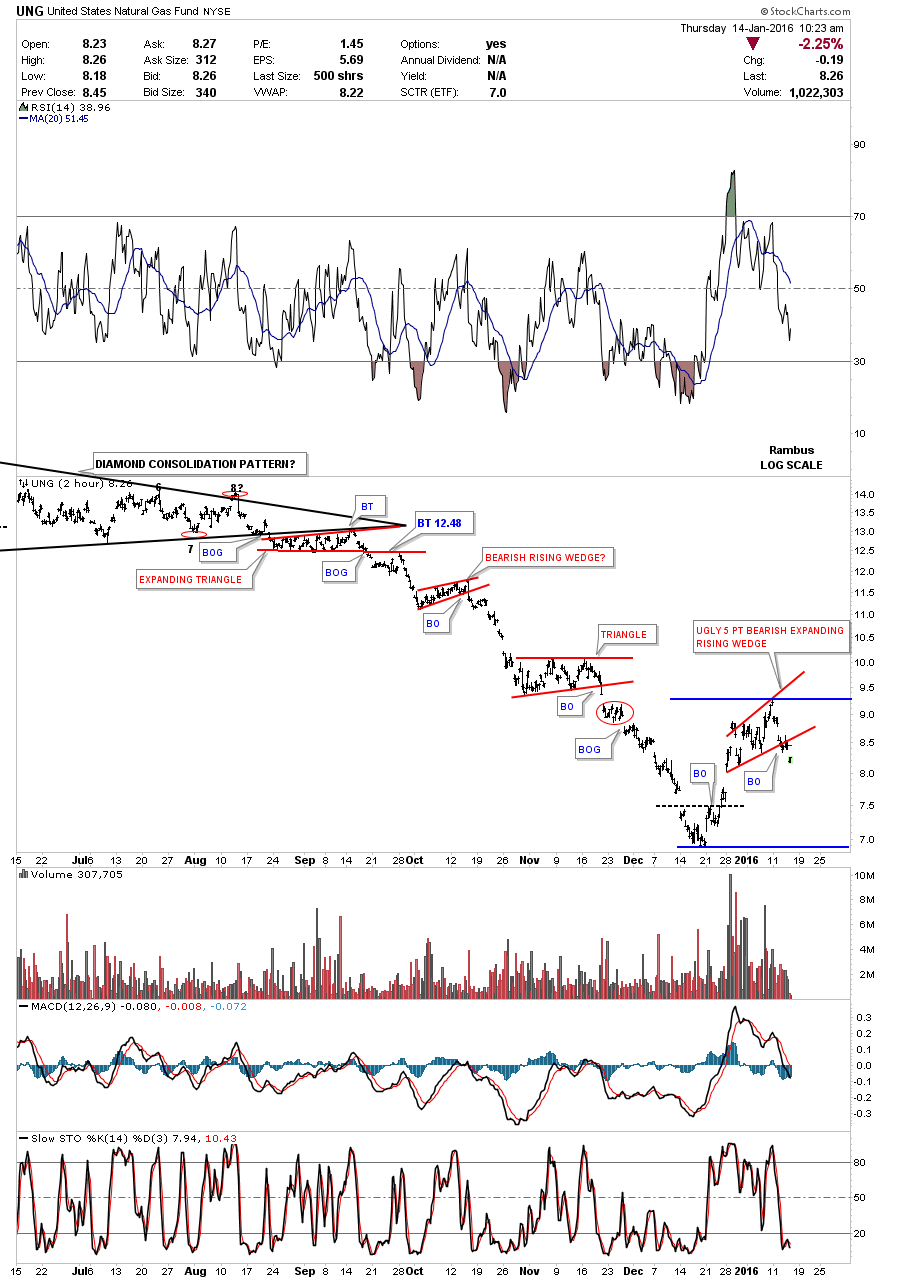
Below is a two hour chart for the UNG, US natural gas fund, which got a bounce off the low and has been in a small trading for the last since late December. I’m calling this pattern a 5 point bearish expanding rising wedge reversal pattern. As we need the trend has been up I needed to see a reversal pattern form with an odd number of reversal points which this pattern now has. The top rail isn’t as clean as I like to see but it’s the essence of the pattern which is important. The blue trendlines represents a possible trading range that may develop consolidating the first massive impulse move down.
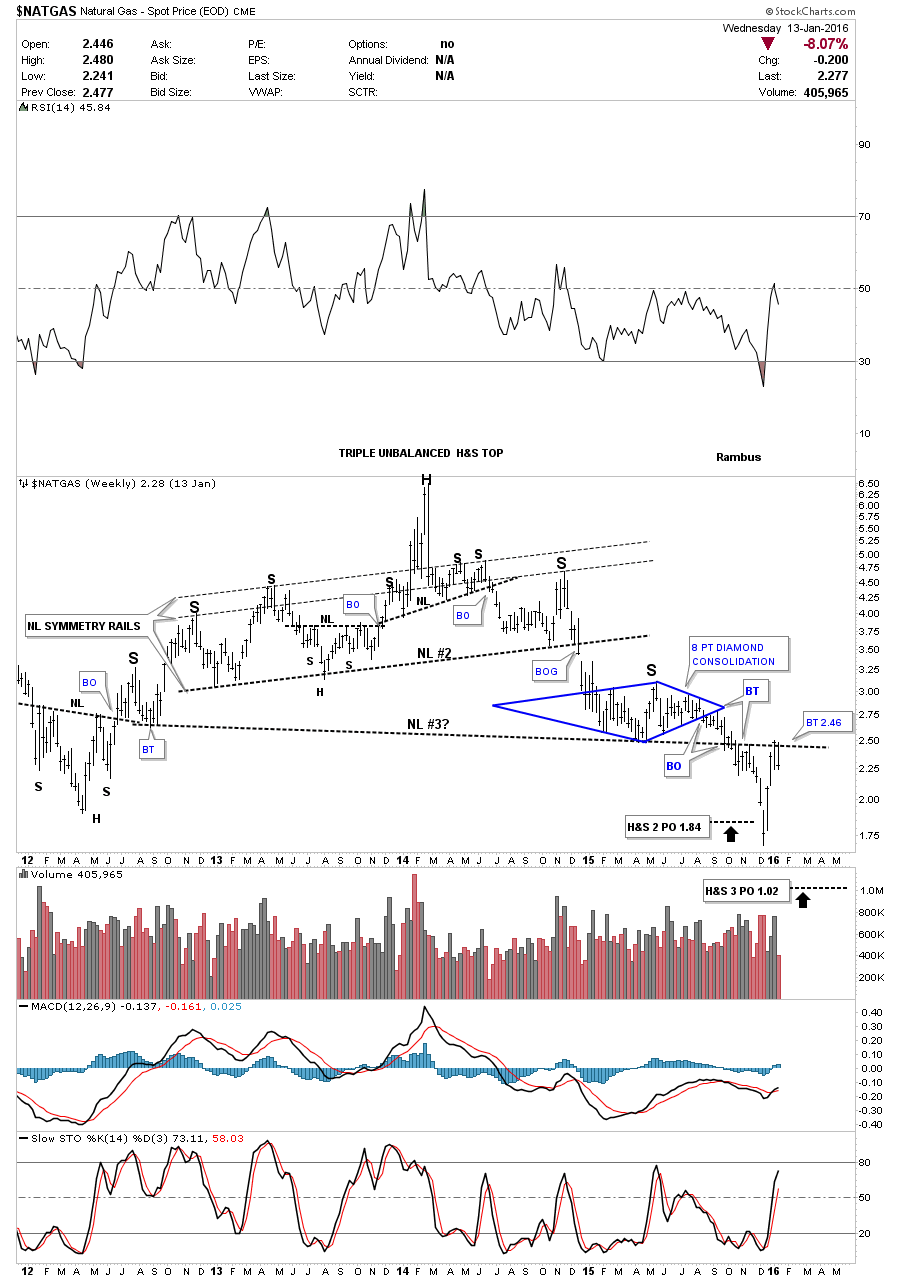
Below is a weekly chart for $NATGAS which I’ve been showing which shows the triple H&S top. As you can see the neckline #2 price objective was reached when we got our current counter trend rally back up to neckline #3 at 2.46. We have a pretty clean line in the sand using neckline #3. Above it will be bullish and below bearish.
Based on the two charts above I’m gong to take an initial small position and buy 1000 shares at the market at 13.89 with the sell/stop placed just below the top blue rail at 8.83. This is a very risky and volatile etf to trade so take very small positions. KOLD is a 2 X short natural gas etf. The more conservative members will want to wait and see if DGAZ backtests the top rail at 8.95 to take this trade and keep risk to a minimum.
