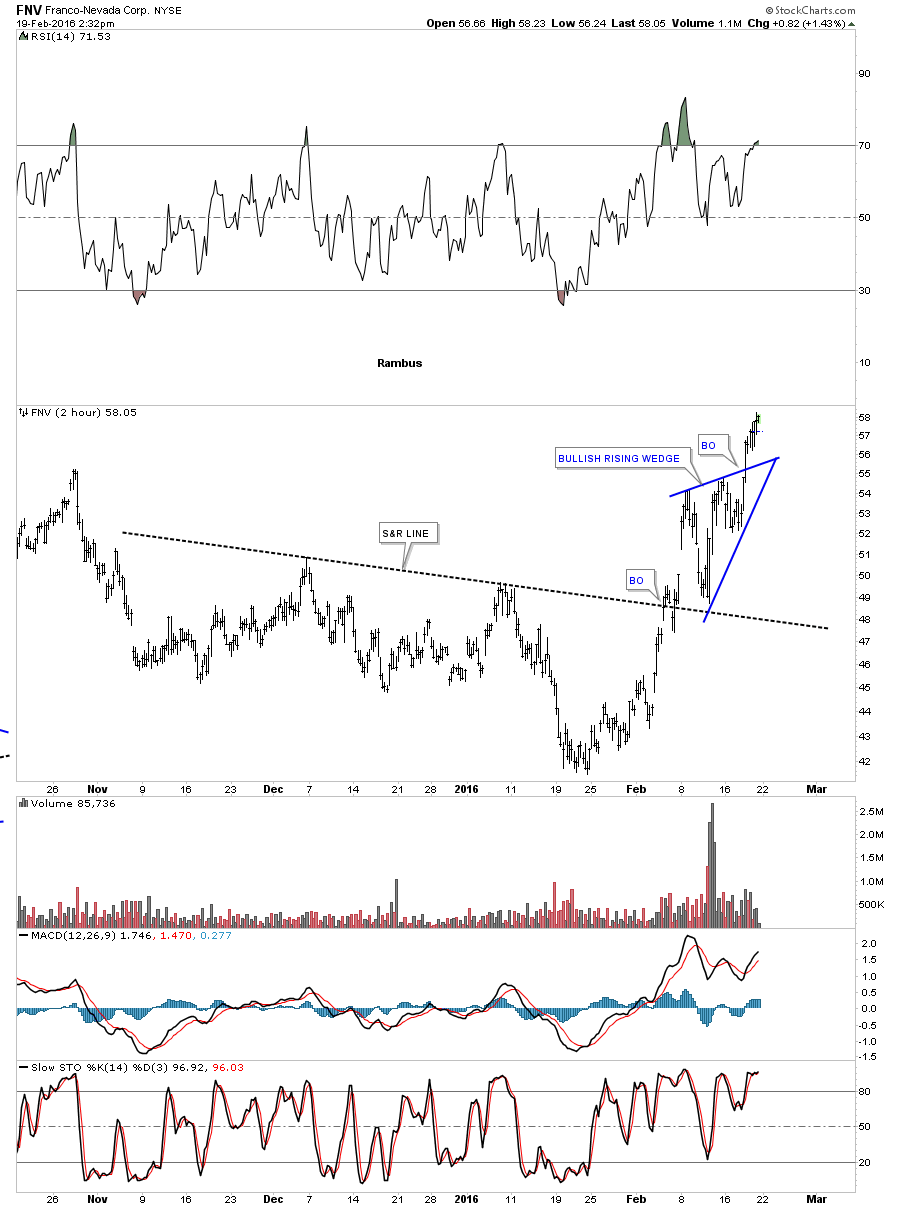
When a good move begins it’s always nice to see the leaders leading. FNV was one of the leaders during the bull market years. Starting with the 2 hour chart FNV has built out a blue bullish rising wedge and has broken out topside. Remember these types of patterns show up in strong impulse moves.
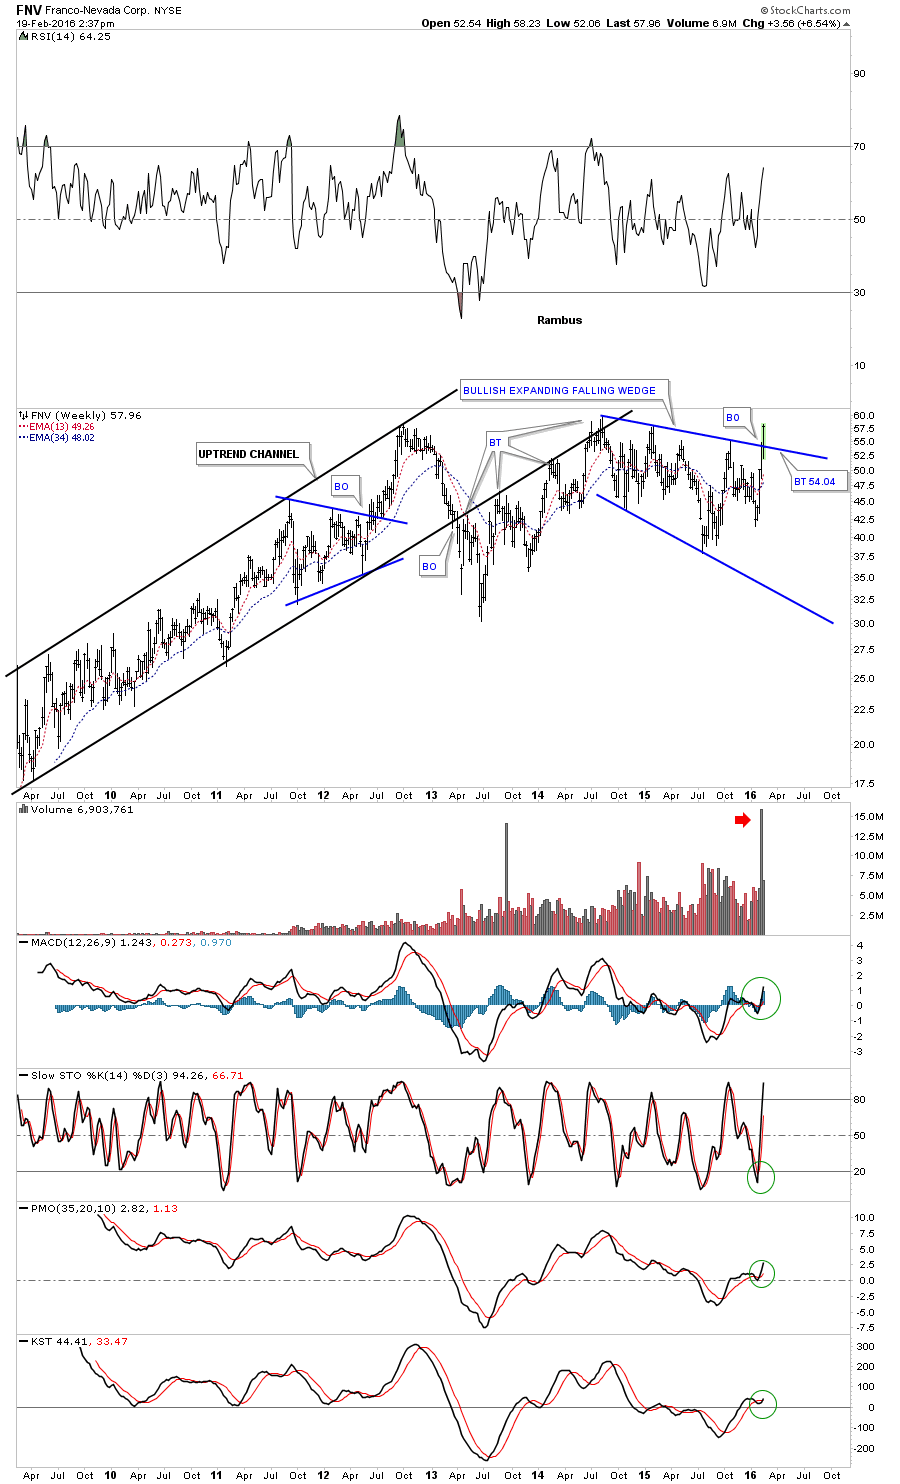
The weekly chart for FNV shows it has broken out from a bullish expanding falling wedge this week and is testing its all time highs. Note the big volume breakout.
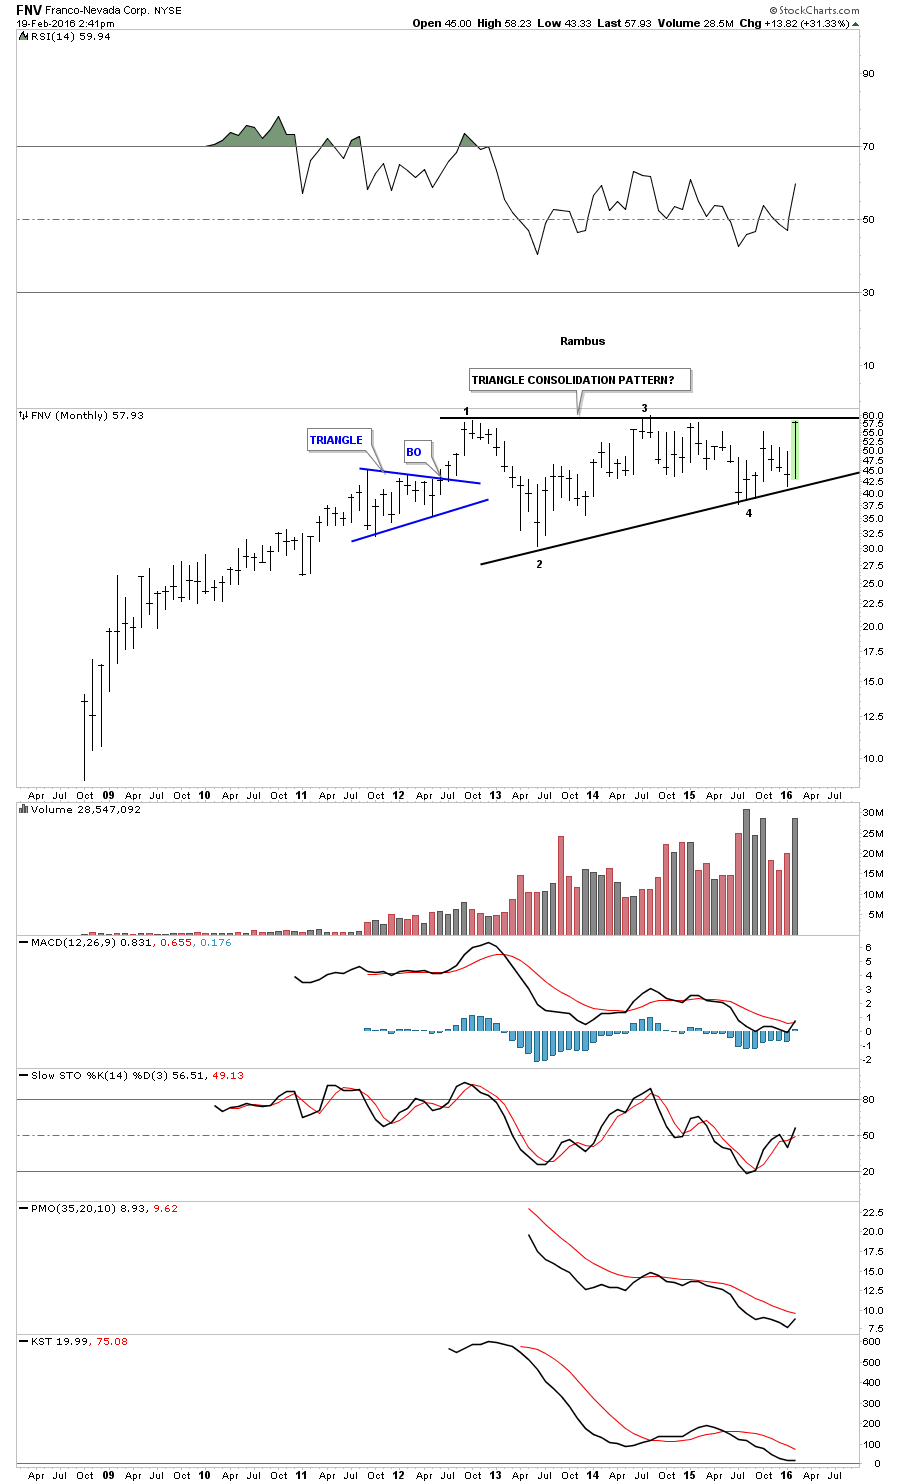
I’ve been showing two different long term monthly charts with one showing a triangle consolidation pattern and the other one was a possible rectangle. Right now the pattern that is winning out is the potential triangle which has just completed its fourth reversal point right at its all time highs. The bullish rising wedge on the 2 hour chart above suggests that there is a good chance that FNV will breakout to new highs as the bullish rising wedge is forming just below the top rail of the four year triangle. Is this previews of coming attractions? I plan on doing the Weekend Report showing some other PM stocks that look to be turning around.