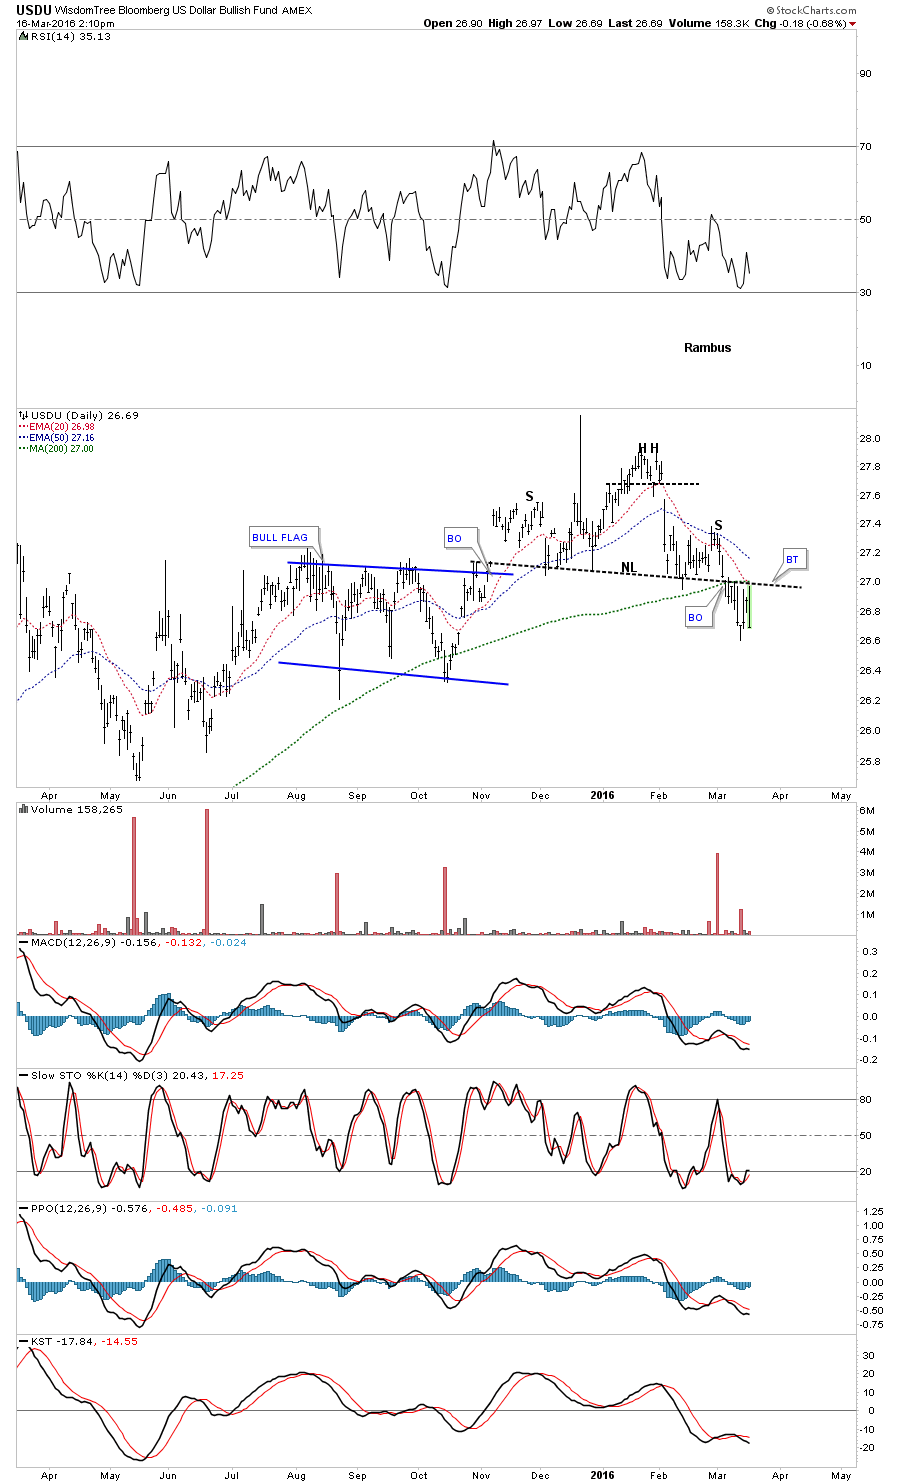
Last week I showed you this potential H&S top forming on the USDU which is a more evenly balanced index for the US dollar which actually trades as an ETF.
http://www.wisdomtree.com/etfs/fund-details-currency.aspx?etfid=91
I built this chart using a line chart and then leaving the trendlines in place I converted to a bar chart. As you can see it has been backtesting the neckline for the last week or so along with the 200 dma. This chart shows a reversal pattern which sets up a downtrend of some kind. This is an important development.
Below is the exact same chart shown as a line chart. Note how much cleaner the trendlines look.

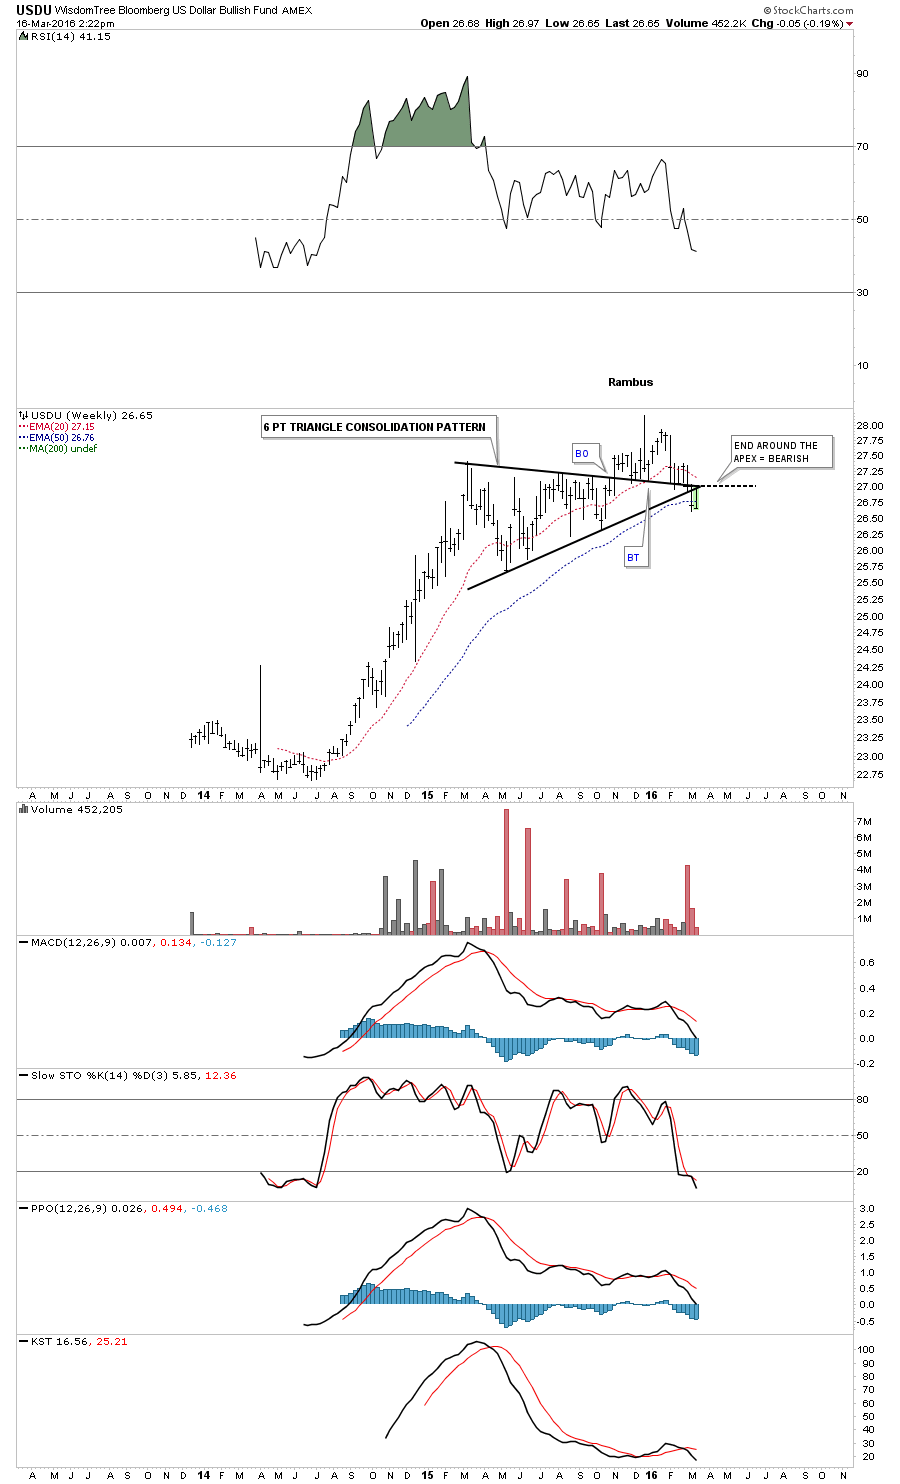
The weekly chart shows an end around the apex move which is also bearish.