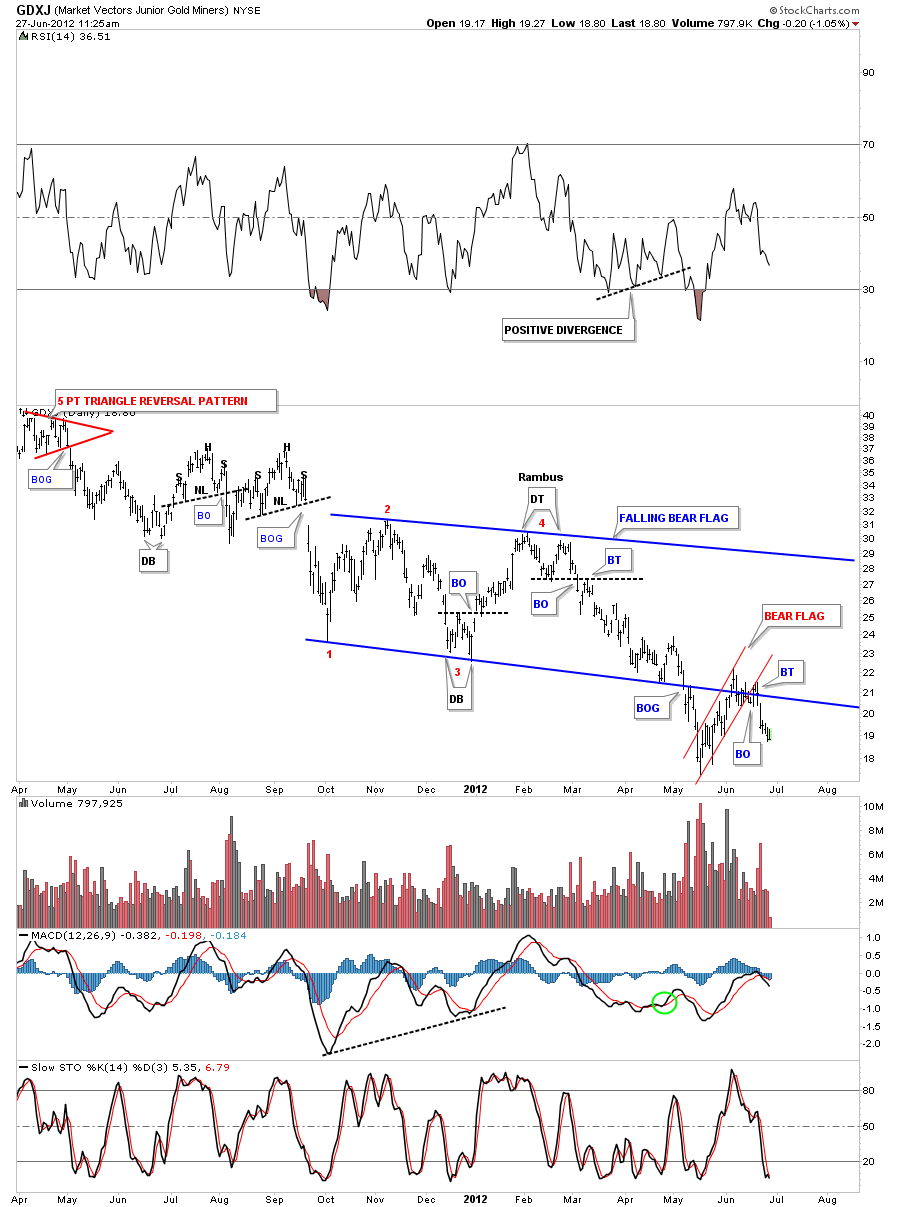
Yesterday I posted a look at SLW and SIL that showed their big bear flags that had broken down and had their backtest to the underside of the bottom rail. Today I want to show the other stock in the trilogy of big bear flags. I posted this chart of the GDXJ at the same time I posted the charts of SLW and SIL a month or so ago.
Lets start with the daily look that shows the big blue falling bear flag. Instead of rising against the trend it is falling with the downtrend which is even more bearish. Note the breakout gap that accompanied the breakout of the bottom blue rail. The backtest took on the shape of a rising channel or bear flag, in red. The backtest was a little strong as you can see on the chart below but it held and now the downtrend is now in progress again.
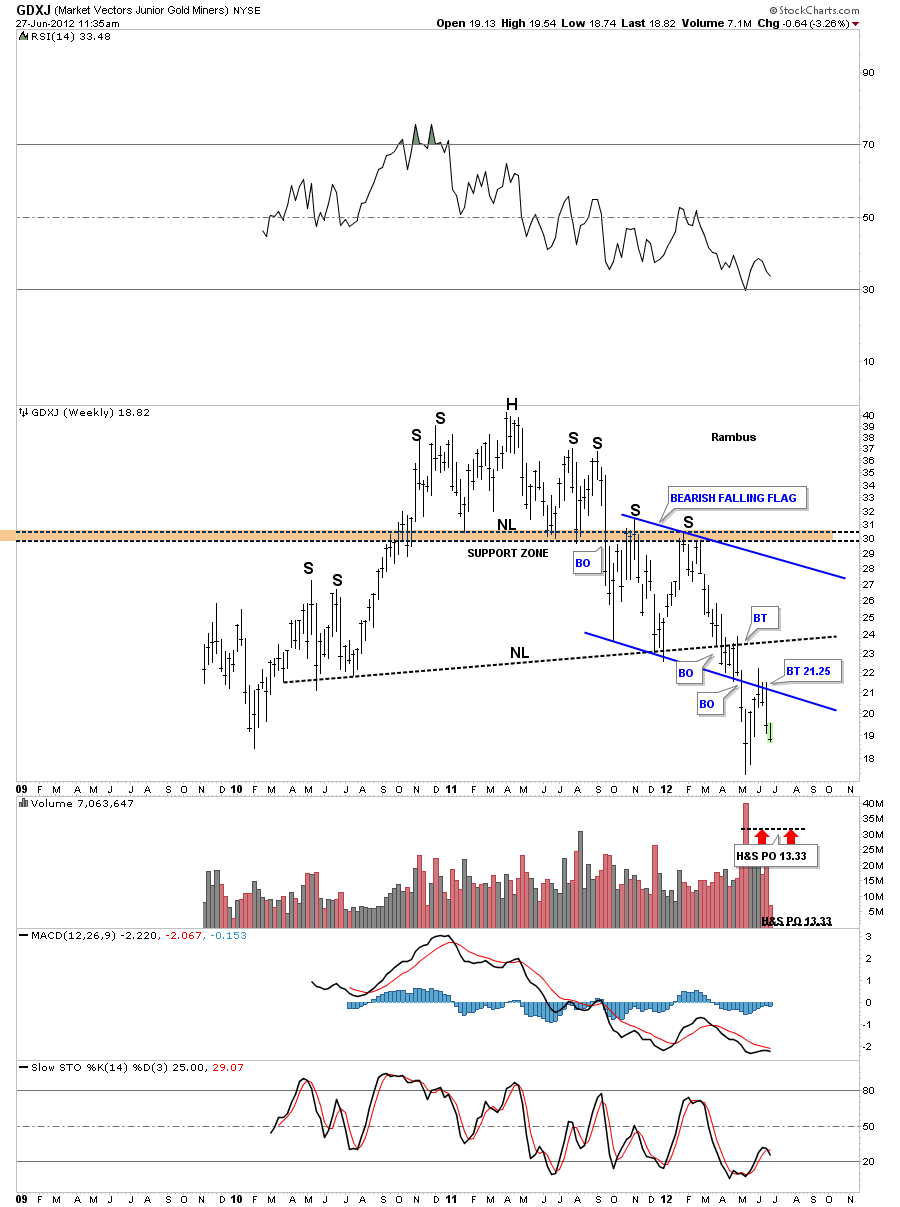
The weekly chart that I showed you had the bearish falling flag that is just part of the much bigger H&S top pattern. You can see there are two H&S top patterns which is more common than one might think. The top, smaller H&S pattern, is just the head portion of the the much bigger H&S top. Also notice how the brown zone or neckline stopped the advance of the right shoulder.
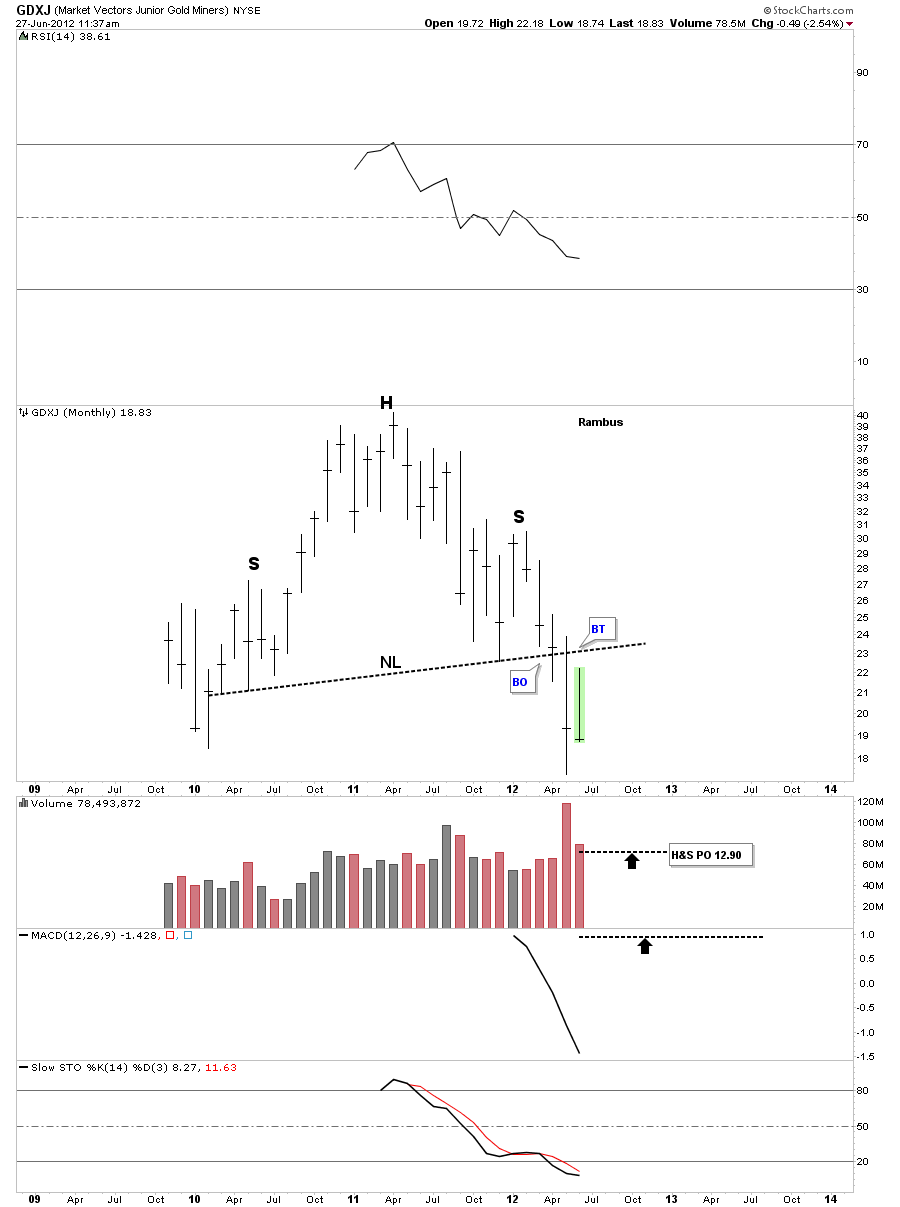
If you are invested in some of the junior precious metals stocks stocks I want you to take a good hard look at this monthly chart of the GDXJ. The only thing that has changed on this chart since the last time I posted it is the last bar on the right side. Folks, that’s a massive H&S top that is in the same league as the ones on the HUI and GDX that I been showing since the first of the year. Very few precious metals investors understand the significance of these massively huge tops that are reversal patterns. They are reversing the uptrend that had been in place since the 2008 crash low. As I said in 2008 and again this year, never ever ignore the implication of these H&S tops. Rambus


