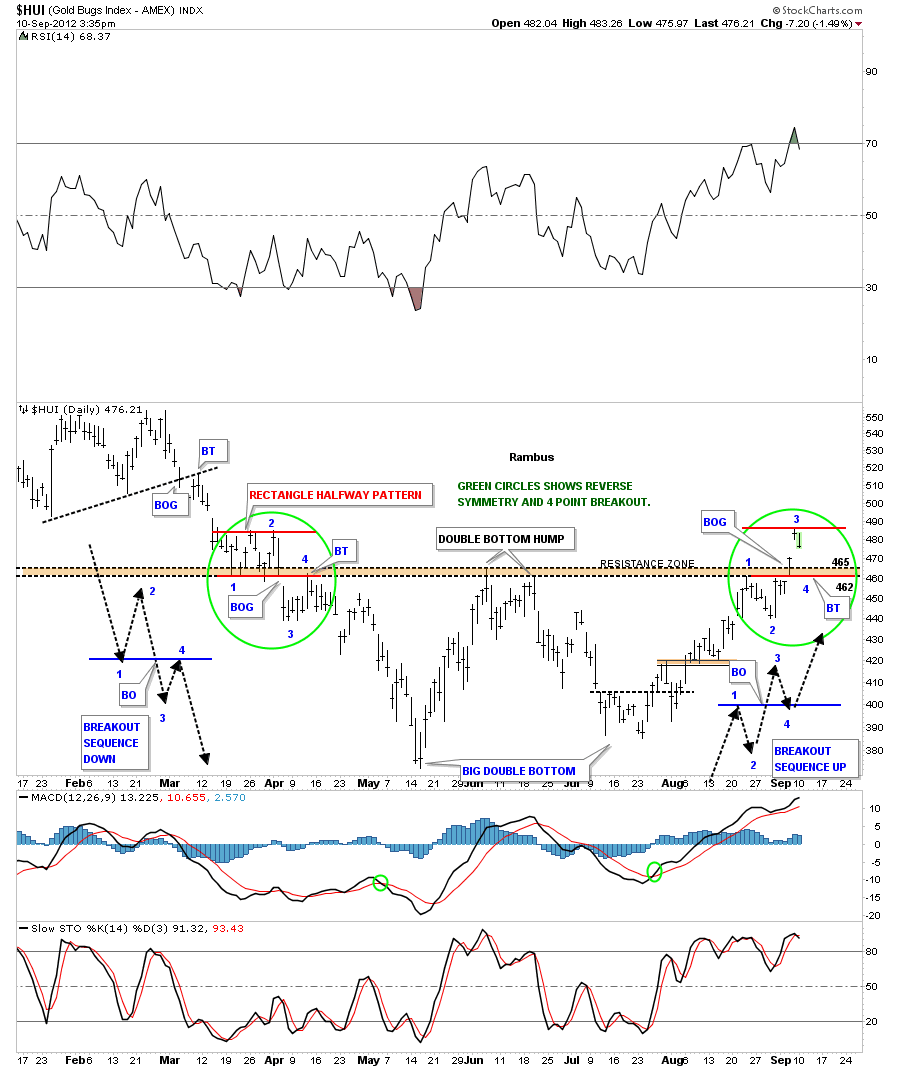
After a strong month of August the HUI looks ready for a small correction back down to the most recent breakout area around the 460 to 465, brown area on chart below. I have add two green circles that show where the reverse symmetry is now located. I have also labeled the breakout sequence one thru four. The four point breakout sequence goes like this. Lets start with the green circle on the left side of the chart. The number 1 represents the first reversal point after finding some support on the decline. Next you get a small counter trend rally that is point number 2. When that little rally fails prices then fall below point number 1 to point number 3. Point number 4 then makes one last small rally attempt that stalls out at the bottom of point number 1 which in now resistance. The black arrows shows how the 4 point breakout system works.
Now I want to focus your attention, on the chart above, to the green circle on the right side of the chart. I’ve labeled the four point breakout sequence that is showing the exact same breakout sequence as the left green circle only this time it is up instead of down. We should now be in the point four decline to the breakout area at 460 to 465 which would be the top of point number one. I don’t know if any of you can see how beautiful the symmetry is on this chart but from my perspective its as pretty as it gets. We will buy another stock or two when the price action gets back down to the brown horizontal area that should now act as support.

