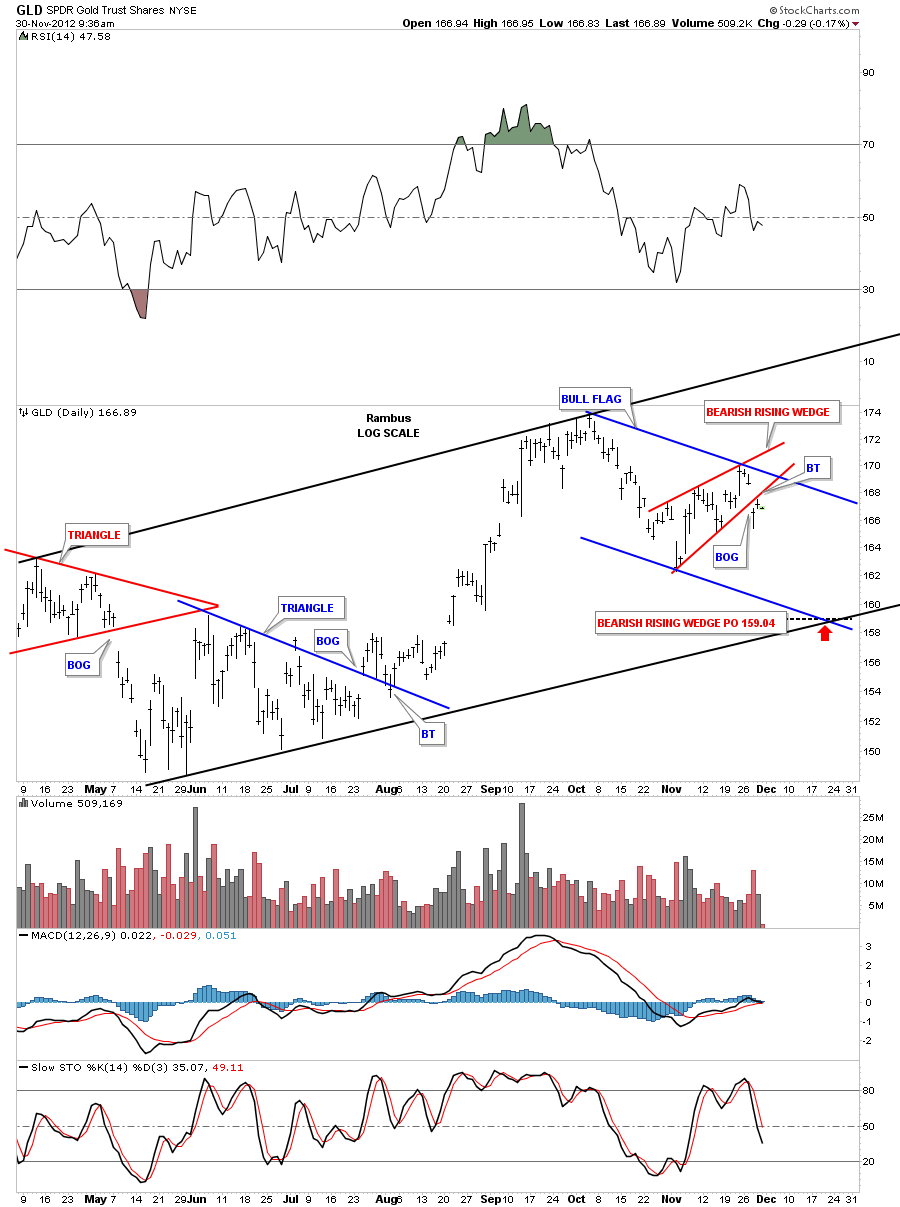
I’ve been studying the GLD to figure out why GLD broke down the other day with a big gap. It drastically changed the short term picture that had been in place. It looks like there could be a small red bearish rising wedge halfway pattern that is showing up within the confines of a bigger blue bull flag. Elliot wave guys would call this an ABC correction within the uptrend channel. If we see some weakness today we will sell our UGLD.. The chart below shows the possible setup if GLD can’t trade back above the bottom rail of the red bearish rising wedge. The price objective would be around the 158.81 area.
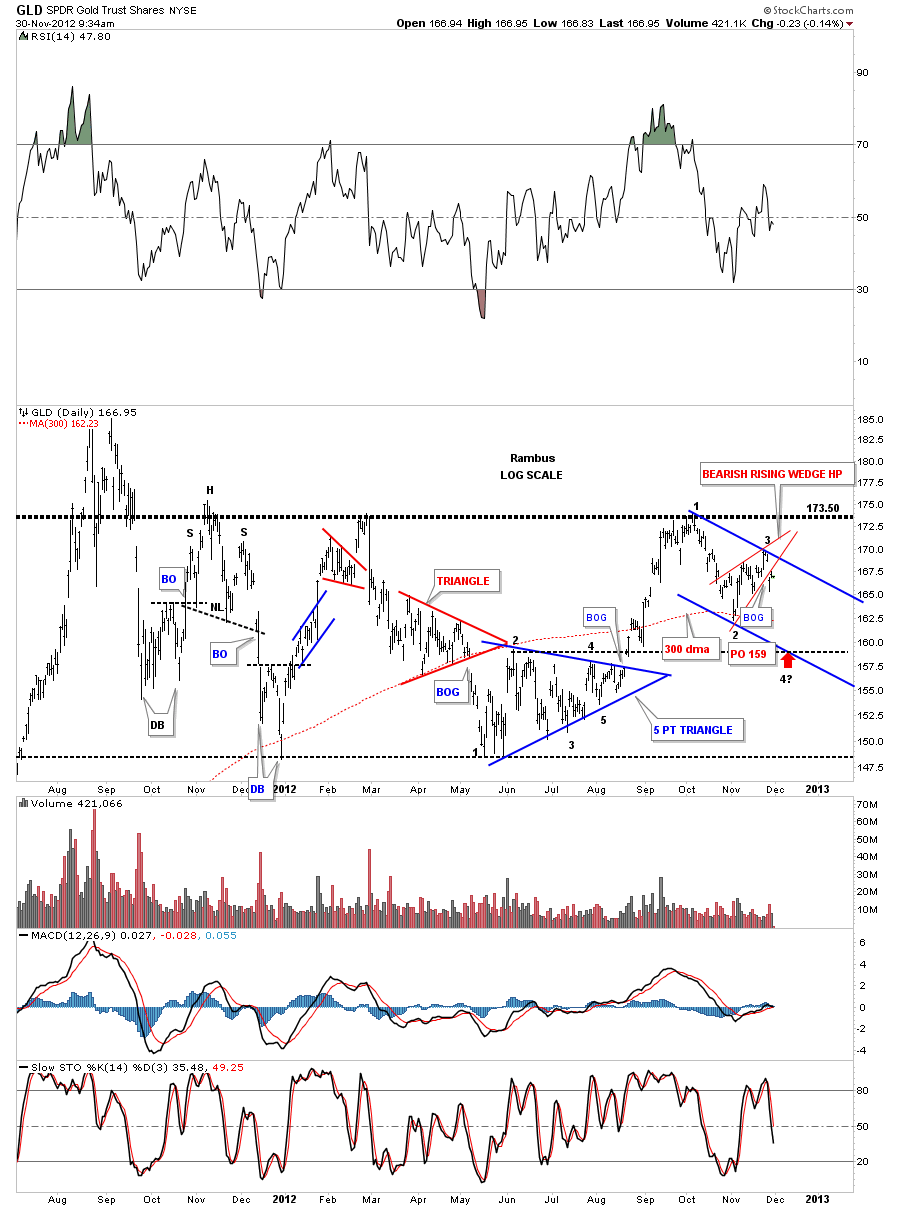
This longer term chart for GLD shows the price action trading below the top rail of the rectangle. 
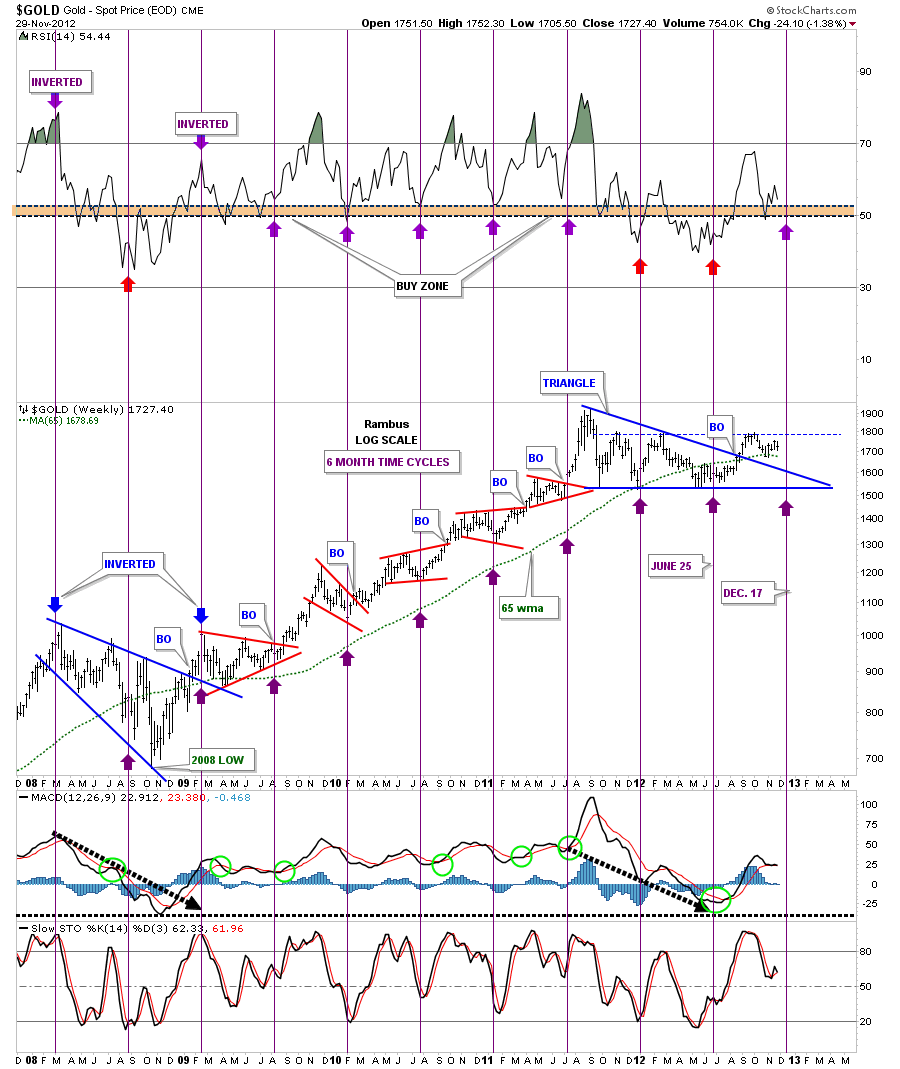
Below is a 6 month time cycle chart for gold that has done a pretty good job of calling the bottoms since 2009. It shows another 6 month time cycle bottom is due around the 17th of December. This may indicate that gold still has some more chopping around to do for the next 2 weeks.


